Washington and U.S. per capita personal income
| Year | Washington | U.S. |
|---|---|---|
| 2023 | $79,659 | $68,531 |
| 2022 | $78,161 | $67,920 |
| 2021 | $81,925 | $71,153 |
| 2020 | $77,852 | $68,052 |
| 2019 | $73,737 | $64,598 |
| 2018 | $70,575 | $62,886 |
| 2017 | $68,382 | $61,399 |
| 2016 | $66,510 | $59,981 |
| 2015 | $64,849 | $59,461 |
| 2014 | $62,303 | $57,372 |
| 2013 | $59,641 | $55,804 |
| 2012 | $59,923 | $56,332 |
| 2011 | $57,439 | $55,322 |
| 2010 | $54,340 | $53,939 |
| 2009 | $56,424 | $53,213 |
| 2008 | $59,533 | $55,153 |
| 2007 | $59,107 | $55,026 |
| 2006 | $56,660 | $53,950 |
| 2005 | $54,530 | $52,283 |
| 2004 | $54,754 | $51,548 |
| 2003 | $52,957 | $50,472 |
Inflation-adjusted to 2023 dollars
1980-2023
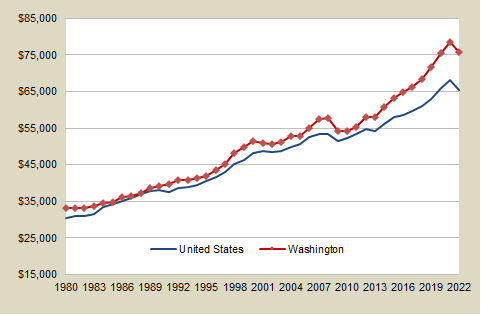
- Personal income includes all income earned by Washington households, including wages, self-employment income, interest, dividends, rent, social security, and other transfer payments.
- Washington per capita personal income has been higher than that of the United States overall in almost every year since 1980.
- Income from stock options and software industry wages helped boost Washington's per capita income in the late 1990s.
- In the fourth quarter of 2004 Microsoft paid a dividend of $3 per share, which increased the growth rate of Washington's personal income in 2004 by three percentage points above what it would have been without the dividend.
- In 2023, Washington state ranked 6th among the States and District of Columbia in per capita personal income.
Data source:
- Personal income and inflation adjustment: U.S. Bureau of Economic Analysis
E-mail: OFM.Forecasting@ofm.wa.gov
Last updated
Tuesday, June 4, 2024


