Unemployment rates
Washington and U.S.
| Year | Washington | U.S. |
|---|---|---|
| 2022 | 4.2% | 3.6% |
| 2021 | 5.2% | 5.3% |
| 2020 | 8.5% | 8.1% |
| 2019 | 4.2% | 3.7% |
| 2018 | 4.5% | 3.9% |
| 2017 | 4.7% | 4.4% |
| 2016 | 5.3% | 4.9% |
| 2015 | 5.6% | 5.3% |
| 2014 | 6.1% | 6.2% |
| 2013 | 7.0% | 7.4% |
| 2012 | 8.1% | 8.1% |
| 2011 | 9.3% | 8.9% |
| 2010 | 10.0% | 9.6% |
| 2009 | 9.2% | 9.3% |
| 2008 | 5.4% | 5.8% |
| 2007 | 4.5% | 4.6% |
| 2006 | 5.0% | 4.6% |
| 2005 | 5.6% | 5.1% |
| 2004 | 6.3% | 5.5% |
| 2003 | 7.4% | 6.0% |
| 2002 | 7.4% | 5.8% |
1970-2022
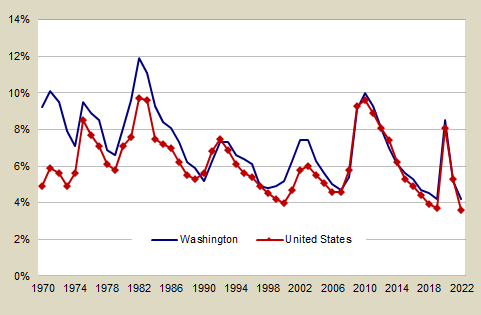
- Historically, the unemployment rate in Washington has been higher than the U.S. average, due primarily to a relatively high share of resource-based industries in the state which have more volatile seasonal employment patterns.
- Change in Washington unemployment rates has tracked closely with the U.S. trend, but the difference between the state and the U.S. rates usually widens during the economic downturns.
- The 2000-2003 run-up in jobless rates was a result of the bursting of the Dot-Com bubble in conjunction with the 9/11 recession; this had a more pronounced impact on the Seattle area because of the localized concentration of Dot-Com start-ups and aerospace employment.
- The most jump in unemployment rates was related to the breaking of the housing market/equities/commodities bubble which hit Washington and the nation with similar force.
- U.S. and Washington unemployment rates tracked more closely this last recession than they had historically.
Data source:
E-mail: OFM.Forecasting@ofm.wa.gov
Last updated
Friday, August 18, 2023
