Washington export activity
Value of Washington exports
2022 ($ Millions)
| Industry | Value |
|---|---|
| Total all Industries | $61,209 |
| Transportation Equipment | $21,414 |
| Agricultural Products | $12,791 |
| Food & Kindred Products | $4,799 |
| Computer & Electronic Products | $4,321 |
| Petroleum & Coal Products | $3,050 |
| Machinery, Except Electrical | $2,765 |
| Chemicals | $1,362 |
| Electrical Equipment | $1,202 |
| Other Special Cassification | $1,038 |
| Fish, fresh/chilled/frozen & other Marine Products | $1,003 |
1997 to 2023
Inflation-Adjusted to 2023 Dollars
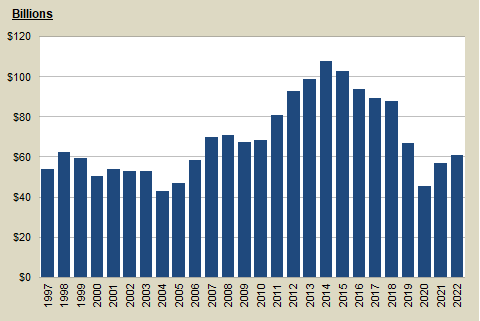
- Between 1997 and 2005, Washington exports averaged of $40 billion of goods per year.
- Between 2004 and 2008, total exports jumped from $34 billion to $55 billion due largely to a doubling of transportation equipment exports. The leveling off in 2008 was a result of a disruption in aircraft orders due to a protracted labor/management dispute. The slowdown in 2009 exports was due to the global recession.
- Transportation equipment, primarily aircraft and parts, accounted for over 35.0% of Washington exports in 2023. Aircraft typically accounts for over 40% of Washington exports, but the pandemic decline in air travel, and the 737 Max difficulties, resulted in a significant decline in Washington aircraft deliveries in 2020, 2021, and 2022.
- Washington has consistently ranked in the top five states in exports during the last decade, and in 2023 ranked 8th in total value of exports behind Texas, California, Louisiana, New York, Illinois, and Michigan.
Data source:
- Foreign Trade: U.S. Census Bureau
E-mail: OFM.Forecasting@ofm.wa.gov
Last updated
Friday, May 17, 2024


