


Economic trends
In This Section
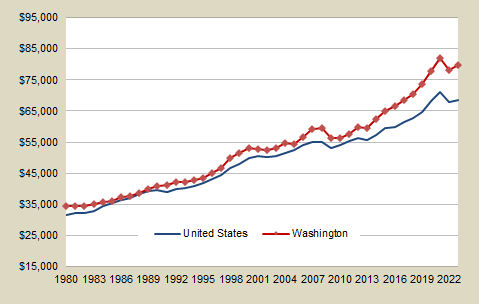
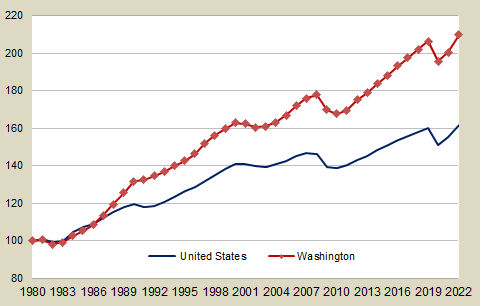
Washington and U.S. average wages
Average wages
Inflation-adjusted to 2022 dollars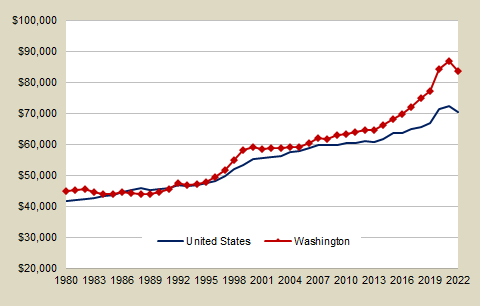
- Washington started the decade of the 1980s in much better economic condition than the U.S. overall.
- During the 1980s, high-paying jobs were lost as some production was shifted abroad. High real interest rates in the U.S. further depressed the demand for durable goods. Washington average wages were lower than the U.S. average wages during the years 1987-1990.
- Real average wages started rising again in 1989 as the state benefited from growth in aerospace employment and foreign trade while the U.S. economy was in recession.
- The fast growth in average wages during the mid- to late 1990s proved to be unsustainable as high-wage, but non-performing Dot-Com firms fell by the wayside.
- The post 9/11 recession suppressed average wages in the early part of the decade, and significant growth did not resume until 2006.
- The Great recession resulted in a decline in average wages in 2008 for both Washington and the U.S.
- Washington state ranked 5th among the states and District of Columbia in average wages in 2022.
| Year | Washington | U.S. |
|---|---|---|
| 2022 | $83,665 | $70,282 |
| 2021 | $86,772 | $72,252 |
| 2020 | $84,064 | $71,172 |
| 2019 | $77,191 | $66,698 |
| 2018 | $74,733 | $65,477 |
| 2017 | $71,850 | $64,681 |
| 2016 | $69,654 | $63,670 |
| 2015 | $68,015 | $63,427 |
| 2014 | $66,128 | $61,653 |
| 2013 | $64,631 | $60,648 |
| 2012 | $64,362 | $60,824 |
| 2011 | $63,895 | $60,419 |
| 2010 | $63,239 | $60,255 |
| 2009 | $63,907 | $59,785 |
| 2008 | $61,521 | $59,609 |
| 2007 | $61,931 | $59,828 |
| 2006 | $60,310 | $58,705 |
| 2005 | $58,993 | $57,683 |
| 2004 | $58,877 | $57,307 |
| 2003 | $58,573 | $56,249 |
| 2002 | $58,594 | $55,715 |
Data source
- Personal income and inflation adjustment: U.S. Bureau of Economic Analysis
Average wages by county (map)
Average Wages, 1980
Inflation-Adjusted to 2022 Dollars
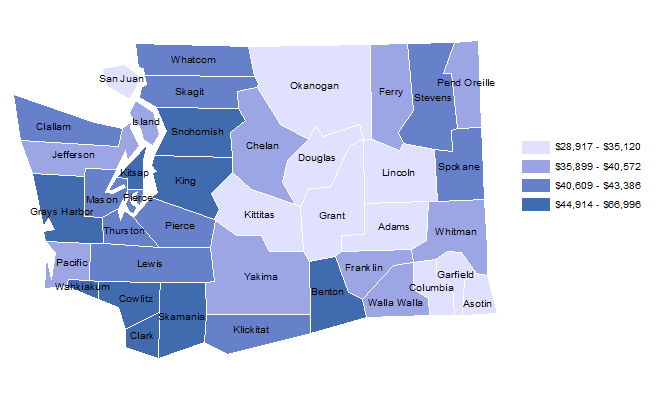
- In 1980, the average wage for Washington state was $46,652 (inflation adjusted to 2022 dollars).
- Garfield and San Juan counties had the lowest average wages at $28,917 and $29,814, respectively.
- Skamania County had the highest average wage at $66,996 because of the high construction wages at the North Bonneville Dam project.
- Seven counties had average wages higher than the state average.
Average Wages, 1990
Inflation-Adjusted to 2022 Dollars
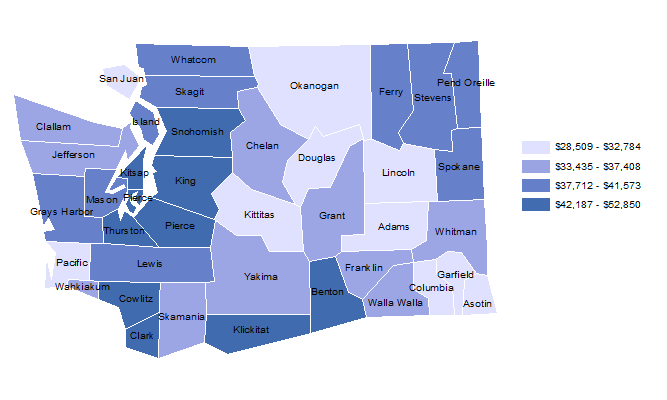
- In 1990, the average wage for Washington state was $46,088 (inflation adjusted to 2022 dollars).
- Columbia and Douglas counties had the lowest average wages at $28,509 and $28,809, respectively.
- King County had the highest average wage at $52,850.
- Four counties had average wages higher than the state average.
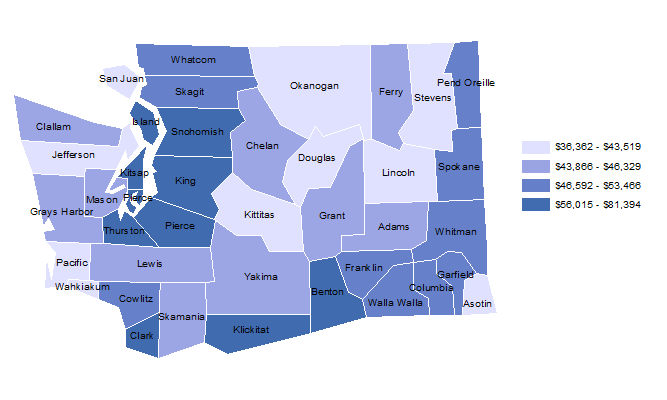
Average Wages, 2000
Inflation-Adjusted to 2022 Dollars
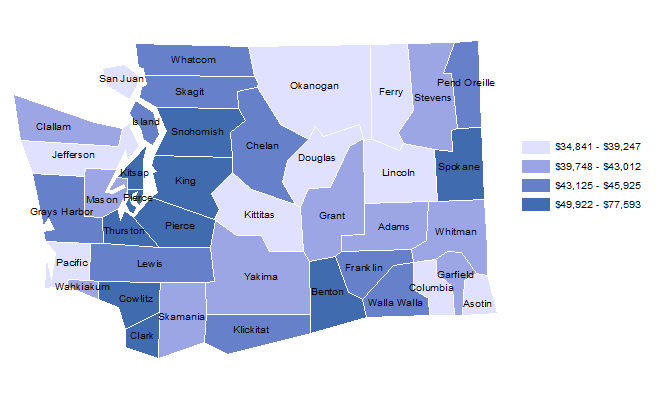
- In 2000, the average wage for Washington state was $61,222 (inflation adjusted to 2022 dollars).
- Okanogan and Pacific counties had the lowest average wages at $36,362 and $36,045 respectively.
- King County had the highest average wage at $81,394 and was the only county with average wage higher than the state average.
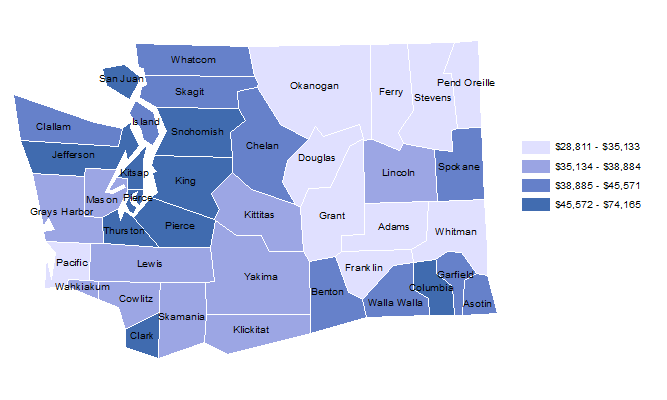
Average Wages, 2010
Inflation-Adjusted to 2022 Dollars
- In 2010, the average wage for Washington state was $65,603 (inflation adjusted to 2022 dollars).
- Okanogan and Asotin counties had the lowest average wagesat $33,014 and $39,310, respectively.
- King County had the highest average wage at $73,903.
- King County and Benton County ($67,065) were the only counties with average wages higher than the state average.
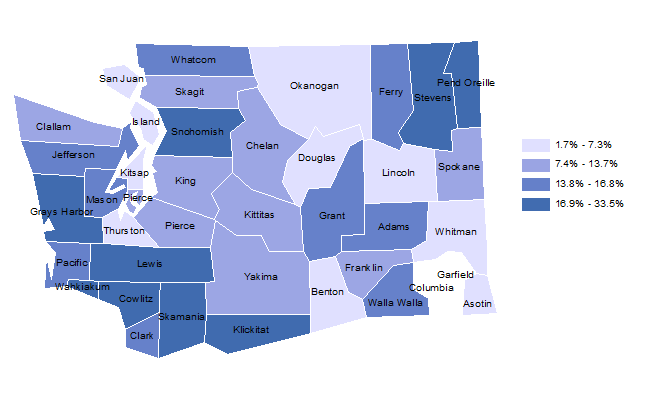
Average Wages, 2022
Inflation-Adjusted to 2022 Dollars
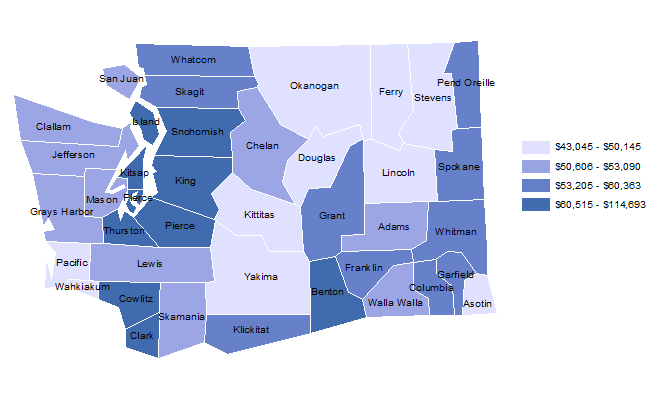
- In 2022 the average wage for Washington state was $83,655.
- Okanogan and Wahkiakum counties had the lowest average wages at $43,048 and $43,045 respectively.
- King County had the highest average wage at $114,693. No other county had an average wage at or above the state average.
Change in Average Wage, 2010-2022
Inflation-Adjusted to 2022 Dollars
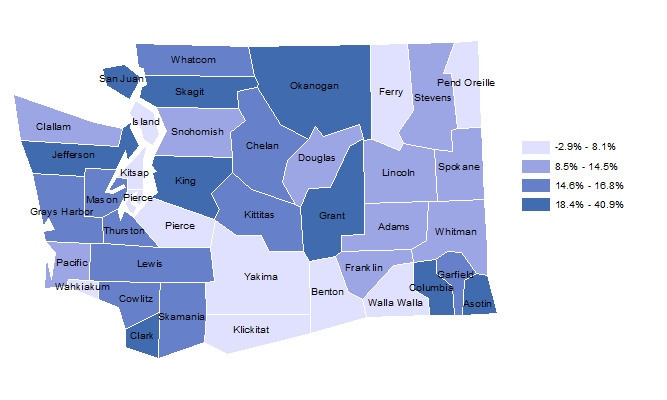
- Overall, between 2010 and 2022, the real average wage for Washington state increased by 27.5%. At the county level, the change ranged from 2.9% in Benton County to 40.9% in King County.
Data sources
- U.S. Bureau of Economic Analysis
- Washington State Revenue Forecast Council – Implicit Price Deflator
Washington export activity
Value of Washington exports
Inflation-Adjusted to 2023 Dollars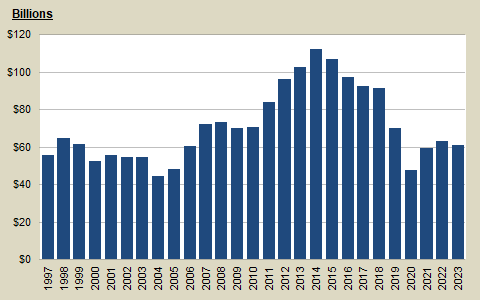
- Between 1997 and 2005, Washington exports averaged of $40 billion of goods per year.
- Between 2004 and 2008, total exports jumped from $34 billion to $55 billion due largely to a doubling of transportation equipment exports. The leveling off in 2008 was a result of a disruption in aircraft orders due to a protracted labor/management dispute. The slowdown in 2009 exports was due to the global recession.
- Transportation equipment, primarily aircraft and parts, accounted for over 35.0% of Washington exports in 2023. Aircraft typically accounts for over 40% of Washington exports, but the pandemic decline in air travel, and the 737 Max difficulties, resulted in a significant decline in Washington aircraft deliveries in 2020, 2021, and 2022.
- Washington has consistently ranked in the top five states in exports during the last decade, and in 2023 ranked 8th in total value of exports behind Texas, California, Louisiana, New York, Illinois, and Michigan.
1997 to 2023
| Industry | Value, 2022 ($ Millions) |
|---|---|
| Total all Industries | $61,209 |
| Transportation Equipment | $21,414 |
| Agricultural Products | $12,791 |
| Food & Kindred Products | $4,799 |
| Wheat and Meslin, Nesoi Corn (Maize), Other than Seed CornCorn (Maize), Other than Seed CornvvvComputer & Electronic Products | $4,321 |
| Petroleum & Coal Products | $3,050 |
| Machinery, Except Electrical | $2,765 |
| Chemicals | $1,362 |
| Electrical Equipment | $1,202 |
| Other Special Cassification | $1,038 |
| Fish, fresh/chilled/frozen & other Marine Products | $1,003 |
Data source
- Foreign Trade: U.S. Census Bureau
Median home price
Median home price in Washington
1996 – 2023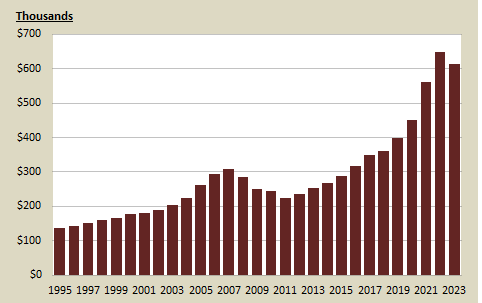
The median home price is a common measurement used to compare real estate prices in different markets and periods. It is less biased than the mean (average) price since it is not as heavily influenced by small number of very highly priced homes. Home prices are limited by various factors, such as the incomes of potential buyers, the cost to construct new property to increase supply, and demand for rental units. Since the vast majority of all homes are purchased with a mortgage, the cost of borrowing money, the ability to borrow money, and the ability to make payments are major influences limiting how far prices can rise. In general home prices in the U.S. are about three times annual household income levels.
Because homes are a large investment, home prices are also used as a proxy for household wealth. Even though homes are relatively illiquid, their value can be tapped via home equity loans as happened with great frequency during the housing bubble.
- Home prices in Washington accelerated quickly from 2002 through 2007,
increasing by over $121,000, a gain of 64%. - Median prices continued to trend upwards in 2023, increasing 5.4% over 2022.
- Median prices in 2023 exceeded 2013 values by 141.5%.
| Year | Median |
|---|---|
| 2023 | $613,000 |
| 2022 | $647,900 |
| 2021 | $560,400 |
| 2020 | $452,400 |
| 2019 | $397,900 |
| 2018 | $362,100 |
| 2017 | $348,900 |
| 2016 | $315,900 |
| 2015 | $289,100 |
| 2014 | $267,600 |
| 2013 | $253,800 |
| 2012 | $236,600 |
| 2011 | $223,900 |
| 2010 | $246,300 |
| 2009 | $250,400 |
| 2008 | $284,400 |
| 2007 | $309,600 |
| 2006 | $293,800 |
| 2005 | $260,900 |
| 2004 | $225,000 |
| 2003 | $203,800 |
Data source
Washington and U.S. per capita personal income
Inflation-adjusted to 2023 dollars
1980-2023
- Personal income includes all income earned by Washington households, including wages, self-employment income, interest, dividends, rent, social security, and other transfer payments.
- Washington per capita personal income has been higher than that of the United States overall in almost every year since 1980.
- Income from stock options and software industry wages helped boost Washington’s per capita income in the late 1990s.
- In the fourth quarter of 2004 Microsoft paid a dividend of $3 per share, which increased the growth rate of Washington’s personal income in 2004 by three percentage points above what it would have been without the dividend.
- In 2023, Washington state ranked 6th among the States and District of Columbia in per capita personal income.
| Year | Washington | U.S. |
|---|---|---|
| 2023 | $79,659 | $68,531 |
| 2022 | $78,161 | $67,920 |
| 2021 | $81,925 | $71,153 |
| 2020 | $77,852 | $68,052 |
| 2019 | $73,737 | $64,598 |
| 2018 | $70,575 | $62,886 |
| 2017 | $68,382 | $61,399 |
| 2016 | $66,510 | $59,981 |
| 2015 | $64,849 | $59,461 |
| 2014 | $62,303 | $57,372 |
| 2013 | $59,641 | $55,804 |
| 2012 | $59,923 | $56,332 |
| 2011 | $57,439 | $55,322 |
| 2010 | $54,340 | $53,939 |
| 2009 | $56,424 | $53,213 |
| 2008 | $59,533 | $55,153 |
| 2007 | $59,107 | $55,026 |
| 2006 | $56,660 | $53,950 |
| 2005 | $54,530 | $52,283 |
| 2004 | $54,754 | $51,548 |
| 2003 | $52,957 | $50,472 |
Data source
- Personal income and inflation adjustment: U.S. Bureau of Economic Analysis
Per capita personal income by county
Per Capita Personal Income, 1980
Inflation-Adjusted to 2022 Dollars
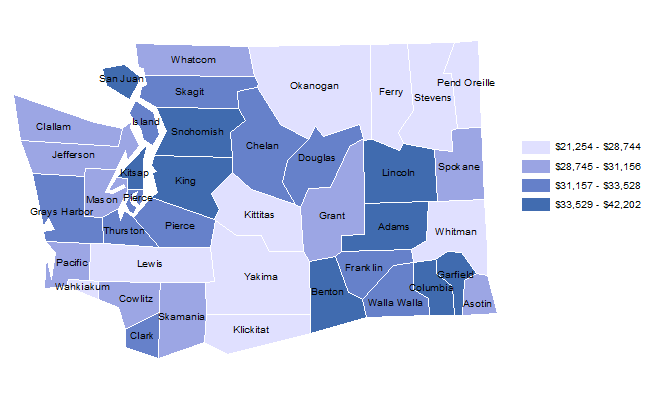
- The 1980 for Washington state was $34,427 (inflation-adjusted to 2022 dollars).
- Pend Oreille and Ferry counties had the lowest per capita personal income at $21,254 and $21,291, respectively.
- At the high end of the spectrum were Garfield ($42,202), King ($41,231) and Lincoln ($39,462) counties.
Per Capita Personal Income, 1990
Inflation-Adjusted to 2022 Dollars
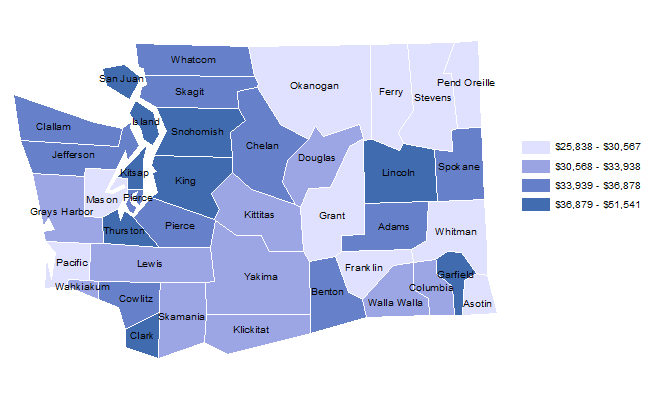
- The 1990 per capita personal income for Washington state was $40,719 (inflation-adjusted to 2022 dollars).
- Ferry County had the lowest per capita personal income at the county level at $25,838.
- At the high end of the spectrum was King County at $51,541. San Juan, with per capita income of $47,981, was the only other county with a per capita personal income over $40,000.
Per Capita Personal Income, 2000
Inflation-Adjusted to 2022 Dollars
- In 2000, the Washington state per capita personal income was $48,450 (inflation-adjusted to 2022 dollars).
- Only two counties topped the state average: King County at $67,969 and San Juan County at $59,128.
- Three counties had per capita personal incomes below $30,000: Ferry ($26,133), Franklin ($29,546) and Stevens ($29,414).
Per Capita Personal Income, 2010
Inflation-Adjusted to 2022 Dollars
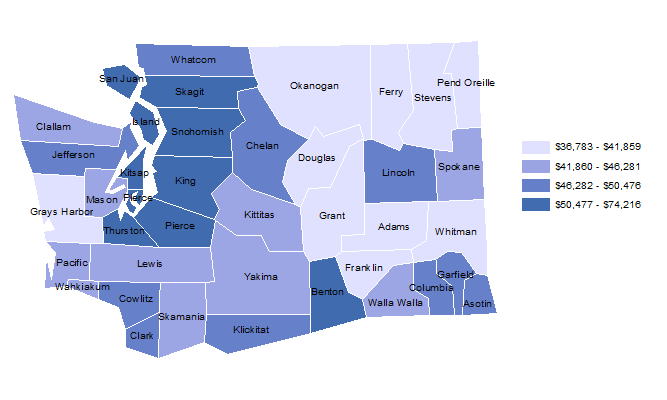
- In 2010, the Washington state per capita personal income was $53,059 (inflation-adjusted to 2022 dollars).
- Only two counties topped the state average: King County at $74,165 and San Juan County at $63,228.
- Three counties had per capita personal incomes below $40,000: Ferry ($36,783), Stevens ($39,232) and Grant ($39,655).
Per Capita Personal Income, 2022
Inflation-Adjusted to 2022 Dollars
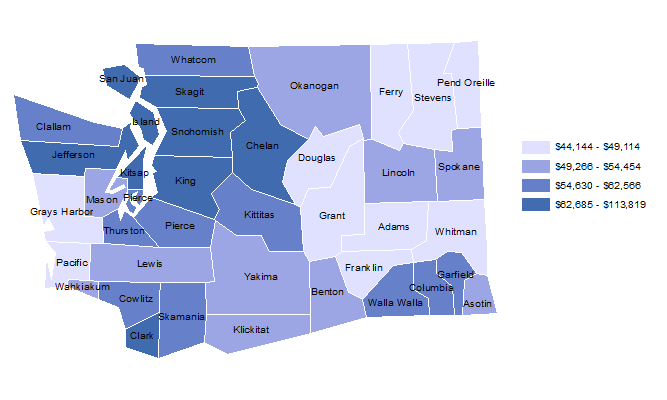
- In 2022, the Washington state per capita personal income was $75,332.
- Two counties bettered the state average: King County at $113,819 and San Juan County at $89,744.
- Three counties had per capital personal income below $47,000: Franklin ($46,072), Whitman ($46,072), and Pacific ($46,498).
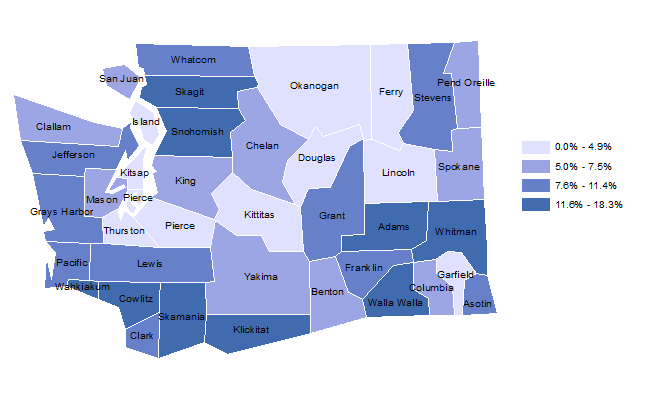
Change in Per Capita Personal Income, 2010–2022
Inflation-Adjusted to 2022 Dollars
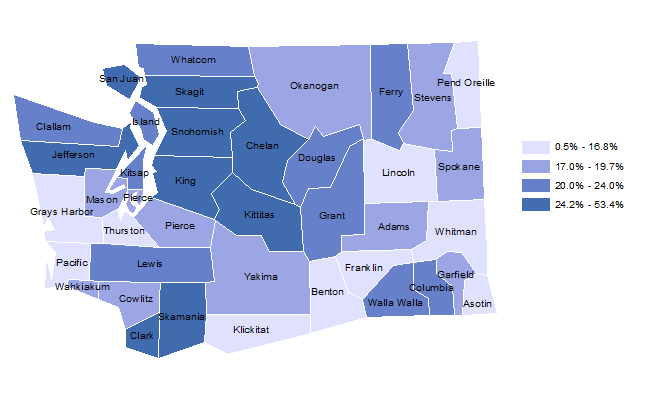
- Overall, inflation-adjusted per capita personal income increased by 33.8% in Washington between 2010 and 2022. At the county level, the change ranged from a 20.0% gain for Franklin County to a 53.4% increase for King County.
Data Sources
- U.S. Bureau of Economic Analysis
- Washington State Revenue Forecast Council – Implicit Price Deflator
Unemployment rates
Washington and U.S.
1970-2023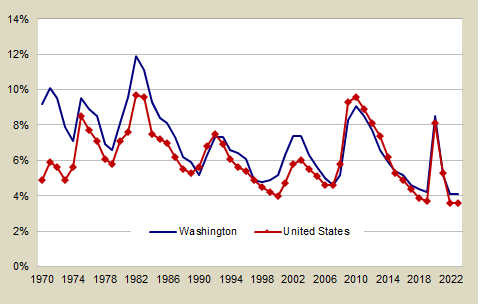
- Historically, the unemployment rate in Washington has been higher than the U.S. average, due primarily to a relatively high share of resource-based industries in the state which have more volatile seasonal employment patterns.
- Change in Washington unemployment rates has tracked closely with the U.S. trend, but the difference between the state and the U.S. rates usually widens during the economic downturns.
- The 2000-2003 run-up in jobless rates was a result of the bursting of the Dot-Com bubble in conjunction with the 9/11 recession; this had a more pronounced impact on the Seattle area because of the localized concentration of Dot-Com start-ups and aerospace employment.
- The most jump in unemployment rates was related to the breaking of the housing market/equities/commodities bubble which hit Washington and the nation with similar force.
- U.S. and Washington unemployment rates tracked more closely this last recession than they had historically.
| Year | Washington | U.S. |
|---|---|---|
| 2023 | 4.1% | 3.6% |
| 2022 | 4.1% | 3.6% |
| 2021 | 5.2% | 5.3% |
| 2020 | 8.5% | 8.1% |
| 2019 | 4.2% | 3.7% |
| 2018 | 4.5% | 3.9% |
| 2017 | 4.6% | 4.4% |
| 2016 | 5.2% | 4.9% |
| 2015 | 5.4% | 5.3% |
| 2014 | 5.9% | 6.2% |
| 2013 | 6.6% | 7.4% |
| 2012 | 7.7% | 8.1% |
| 2011 | 8.5% | 8.9% |
| 2010 | 9.1% | 9.6% |
| 2009 | 8.3% | 9.3% |
| 2008 | 5.2% | 5.8% |
| 2007 | 4.6% | 4.6% |
| 2006 | 5.0% | 4.6% |
| 2005 | 5.6% | 5.1% |
| 2004 | 6.3% | 5.5% |
| 2003 | 7.4% | 6.0% |
Data source
Washington and U.S. wage & salary manufacturing employment
Manufacturing wage & salary employment
1980-2022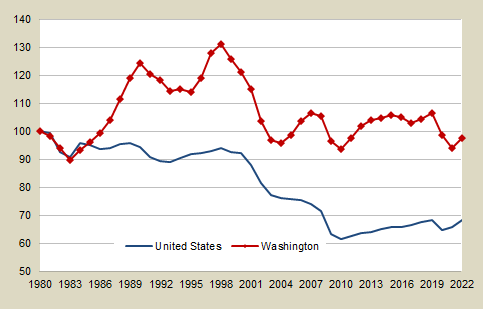
- The sharp drop in Washington manufacturing employment from 1998 to 2004 was due primarily to a loss of over 50,000 jobs in the aerospace sector; since then the sector has added over 23,000 jobs.
- Over the last ten years, employment in manufacturing has dropped an average of 1.4% per year nationally. The reasons for the loss are two-fold — productivity gains have allowed fewer workers produce more goods, and the relocation or contracting for manufacturing work overseas.
| Year | Washington | U.S. |
|---|---|---|
| 2022 | 268,573 | 12,799,000 |
| 2021 | 259,270 | 12,333,000 |
| 2020 | 271,406 | 12,108,000 |
| 2019 | 293,615 | 12,808,000 |
| 2018 | 287,354 | 12,667,000 |
| 2017 | 283,783 | 12,438,000 |
| 2016 | 289,718 | 12,333,000 |
| 2015 | 291,196 | 12,331,000 |
| 2014 | 288,518 | 12,188,000 |
| 2013 | 286,464 | 12,022,000 |
| 2012 | 280,365 | 11,933,000 |
| 2011 | 268,941 | 11,730,000 |
| 2010 | 258,042 | 11,513,000 |
| 2009 | 265,745 | 11,840,000 |
| 2008 | 290,947 | 13,409,000 |
| 2007 | 293,106 | 13,869,000 |
| 2006 | 285,591 | 14,149,000 |
| 2005 | 271,718 | 14,223,000 |
| 2004 | 264,055 | 14,303,000 |
| 2003 | 267,230 | 14,506,000 |
| 2002 | 285,944 | 15,267,000 |
Data source
Manufacturing employment as a percent of total
Manufacturing employment as a percent of total, 1980
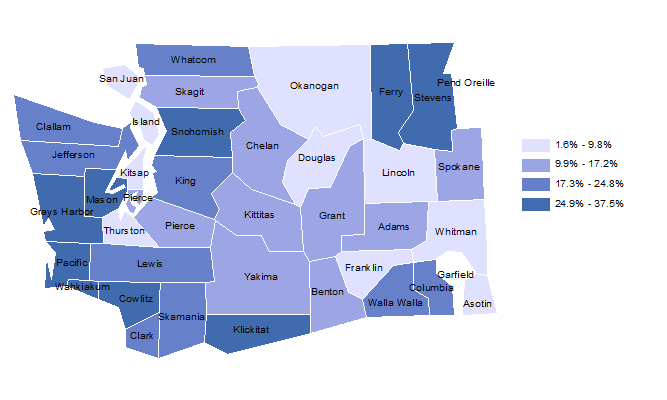
- State average: 17.8%
- Highest county: Wahkiakum at 37.5%
- Lowest county: Whitman at 1.6%
Manufacturing employment as a percent of total, 1990
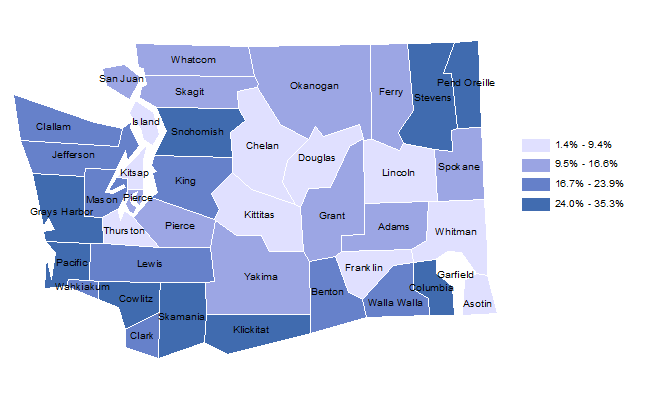
- State average: 16.5%
- Highest county: Columbia at 35.3%
- Lowest county: Whitman at 1.4%
Manufacturing employment as a percent of total, 2000
- State average: 12.7%
- Highest county: Wahkiakum at 33.5%
- Lowest county: Douglas at 1.7%
Manufacturing Employment As a Percent of Total, 2022
- State average: 7.6%
- Highest county: Klickitat at 18.3%
- Lowest county: Garfield at 2.8%
Change in Total Manufacturing Employment, 2010-2022

- State average: 3.6%
- Highest County: Klickitat at 128.4% (an increase from 624 jobs to 1,425 jobs)
- Lowest County: Mason at -45.1% (a decrease from 306 jobs to 168 jobs)
Data source
Washington and U.S. wage and salary employment
Wage & salary employment
1980-2022
From 1980 through 2001:
- Wage and salary employment in Washington grew a total of 64.3% compared to 41.8% nationwide.
- Manufacturing jobs in Washington grew by 10.2%, while declining by 13.2% nationwide.
- Over 480,000 service jobs alone were added to Washington’s labor market, many of these in business services and health care establishments.
From 2001 through 2021:
- From 2001 through 2007 wage and salary employment grew 8.7% in Washington, outpacing the nation’s job growth of 4.5%.
- From 2007 through 2010 non-farm payrolls in Washington and nationwide fell by 5.9% and 5.6% respectively.
- The severity of the Covid-19 shutdowns resulted in annualized employment losses of 5.2% in Washington and 5.9% nationwide.
- The rebound from the Covid-19 shutdowns in 2021 resulted in annualized employment gains of 2.7% in Washington and 3.1% nationwide.
| Year | Washington | U.S. |
|---|---|---|
| 2022 | 3,750,100 | 158,015,000 |
| 2021 | 3,582,684 | 151,768,000 |
| 2020 | 3,494,233 | 147,227,000 |
| 2019 | 3,687,321 | 156,540,000 |
| 2018 | 3,609,042 | 154,362,000 |
| 2017 | 3,527,789 | 151,949,000 |
| 2016 | 3,451,989 | 149,960,000 |
| 2015 | 3,361,729 | 147,641,000 |
| 2014 | 3,280,951 | 144,722,000 |
| 2013 | 3,196,805 | 141,932,000 |
| 2012 | 3,129,288 | 139,619,000 |
| 2011 | 3,028,819 | 136,918,000 |
| 2010 | 2,997,186 | 135,393,000 |
| 2009 | 3,034,438 | 136,242,000 |
| 2008 | 3,177,301 | 142,584,000 |
| 2007 | 3,143,374 | 143,170,000 |
| 2006 | 3,072,918 | 141,660,000 |
| 2005 | 2,983,029 | 139,341,000 |
| 2004 | 2,913,915 | 137,404,000 |
| 2003 | 2,875,510 | 135,967,000 |
| 2002 | 2,865,981 | 136,301,000 |