Washington and U.S. wage & salary manufacturing employment
Manufacturing wage & salary employment
| Year | Washington | U.S. |
|---|---|---|
| 2021 | 259,335 | 12,330,000 |
| 2020 | 271,414 | 12,105,000 |
| 2019 | 293,620 | 12,805,000 |
| 2018 | 287,353 | 12,668,000 |
| 2017 | 283,783 | 12,438,000 |
| 2016 | 289,718 | 12,333,000 |
| 2015 | 291,196 | 12,331,000 |
| 2014 | 288,623 | 12,188,000 |
| 2013 | 286,568 | 12,022,000 |
| 2012 | 280,468 | 11,933,000 |
| 2011 | 269,040 | 11,730,000 |
| 2010 | 258,133 | 11,513,000 |
| 2009 | 265,837 | 11,840,000 |
| 2008 | 291,032 | 13,409,000 |
| 2007 | 293,190 | 13,869,000 |
| 2006 | 285,672 | 14,149,000 |
| 2005 | 271,792 | 14,223,000 |
| 2004 | 264,127 | 14,303,000 |
| 2003 | 267,307 | 14,506,000 |
| 2002 | 286,028 | 15,267,000 |
| 2001 | 317,459 | 16,462,000 |
1980-2021
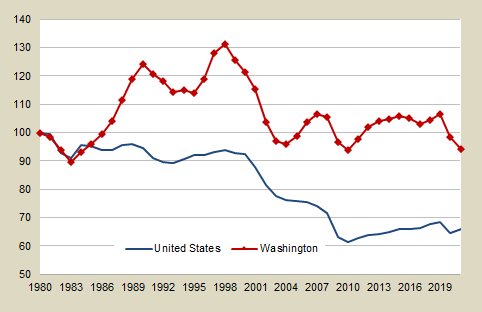
- The sharp drop in Washington manufacturing employment from 1998 to 2004 was due primarily to a loss of over 50,000 jobs in the aerospace sector; since then the sector has added over 23,000 jobs.
- Over the last ten years, employment in manufacturing has dropped an average of 1.4% per year nationally. The reasons for the loss are two-fold -- productivity gains have allowed fewer workers produce more goods, and the relocation or contracting for manufacturing work overseas.
Data source:
E-mail: OFM.Forecasting@ofm.wa.gov
Last updated
Friday, August 18, 2023
