


Population changes
In This Section
Components of population change
2010–2024
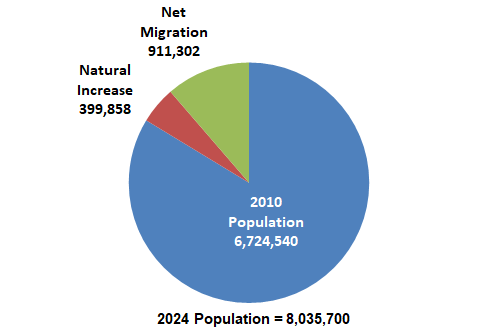
- The natural increase in population — births less deaths — has accounted for about 30.5% of the state’s growth between 2010 and 2024.
- Net migration — people moving in less people moving out — has accounted for about 69.5% of Washington’s population growth between 2010 and 2024.
| Population | |
|---|---|
| 2010 Population | 6,724,540 |
| Plus Births | 1,204,335 |
| Less Deaths | -804,477 |
| Plus Net Migration | 911,302 |
| =2024 Population | 8,035,700 |
2000–2010
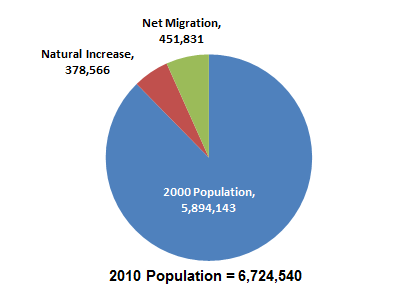
- The natural increase in population — births less deaths — has accounted for about 45.6 percent of the state’s growth between 2000 and 2010.
- Net migration — people moving in less people moving out — has accounted for about 54.4 percent of Washington’s population growth between 2000 and 2010.
| Population | |
|---|---|
| 2000 Population | 5,894,143 |
| Plus Births | 842,082 |
| Less Deaths | 463,516 |
| Plus Net Migration | 451,831 |
| =2010 Population | 6,724,540 |
1990–2000
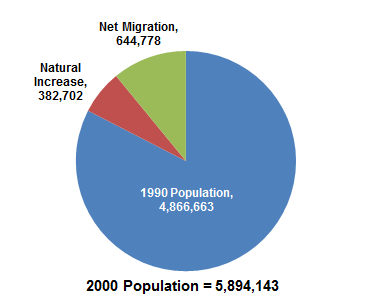
- The natural increase in population — births less deaths — accounted for about 37 percent of the state’s growth between 1990 and 2000.
- Approximately 63 percent of Washington’s population growth between 1990 and 2000 was due to net migration – more people moving in than moving out.
| Population | |
|---|---|
| 1990 Population | 4,866,663 |
| Plus Births | 787,518 |
| Less Deaths | 404,816 |
| Plus Net Migration | 644,778 |
| =2000 Population | 5,894,143 |
Data source
Distribution of Washington population by age and gender
Washington state population by age group
Census 2020
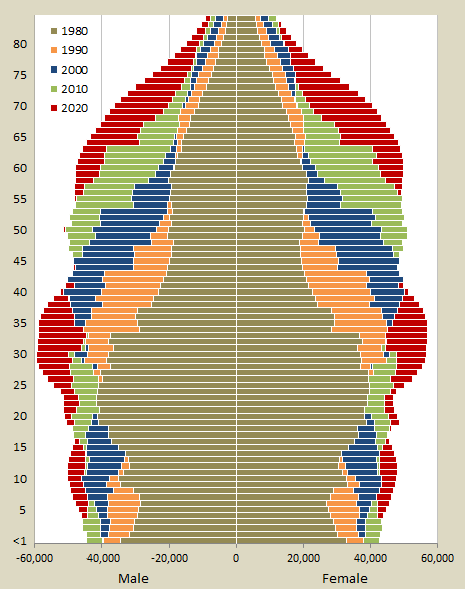
- Population pyramids show the population distribution by age in bar-chart fashion with females on the right and males on the left. Births, deaths, and migration shape the pyramid.
- The bulge centered on the age range of 20 to 30 years in the 1980 pyramid corresponds to the post-World War II Baby Boomers, who were young adults at the early labor force age. This early labor force population was at an all-time high.
- The Baby Boom bulge can be seen maturing in the subsequent profiles. Washington’s median age increased from 29.8 years in 1980 to 37.3 years in 2010, and 38.7 years in 2023.
- The constriction of the pyramid in the ages younger than the Baby Boom shows smaller population in these ages due to the “Baby Bust” – the marked reduction in births following the boom from the mid-1960s through the mid-1970s.
- Most evident at the tip of the population pyramid is the larger number of females in the older age cohorts. Males constitute the majority in each age cohort until the late 40’s after which females outnumber males.
| Age Group | Population |
|---|---|
| 0-4 | 437,142 |
| 5-9 | 473,005 |
| 10-14 | 488,337 |
| 15-19 | 475,428 |
| 20-24 | 494,135 |
| 25-29 | 555,317 |
| 30-34 | 579,568 |
| 35-39 | 561,695 |
| 40-44 | 495,462 |
| 45-49 | 463,942 |
| 50-54 | 464,438 |
| 55-59 | 486,948 |
| 60-64 | 478,618 |
| 65-69 | 425,453 |
| 70-74 | 340,300 |
| 75-79 | 221,272 |
| 80-84 | 134,275 |
| 85+ | 130,975 |
Data source
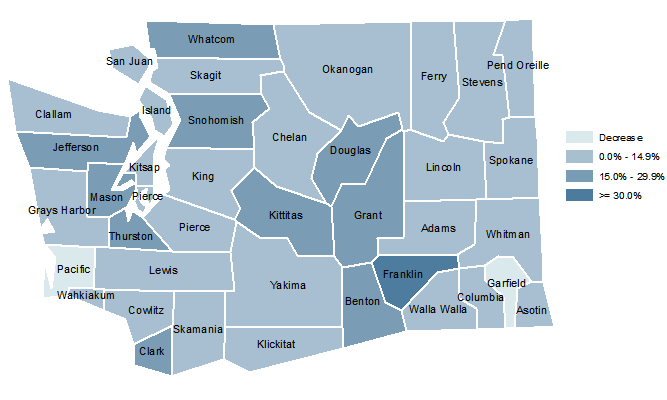
Hispanic population as a percent of total population
2023
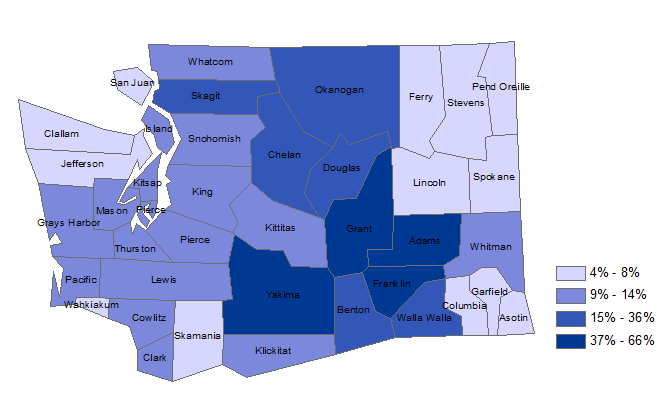
In 2022, the highest percentages of Hispanic residents were found in central Washington with Adams (65.6%), Franklin (55.4%), and Yakima (52.4%) counties posting the highest shares.
Although representing lower shares of the total county population, significant numbers of persons of Hispanic origin lived in western Washington’s largest metropolitan counties, notably King (266,462), Pierce (125,001), and Snohomish (107,120) counties.
Data source
Population by age, mapped by county
Median Age, 2023
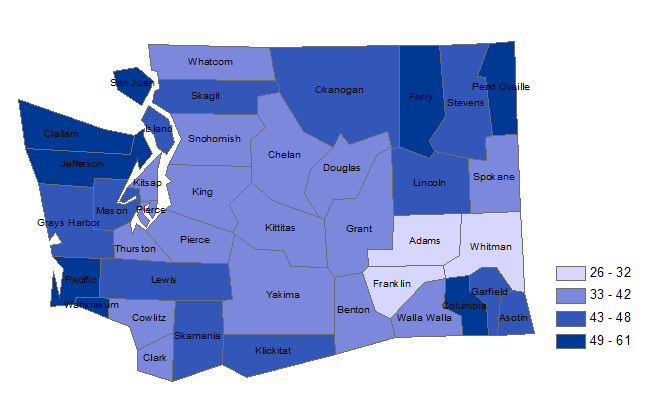
In 2010, the median age of persons living in Washington state was 37.3 years. In 2023 the median age had increased to 38.8 years.
Jefferson County had the highest median age in 2010 at 53.9 years. By 2023, the median age in Jefferson County had reached 64.1 years.
In 2010, Whitman County, home of Washington State University, had the state’s lowest median age at 24.4 years. In 2023, Whitman County still had the lowest median age at 25.5 years. Adams County was the only other county in Washington state with a median age less than 30 years in both 2010 (29.0 years and in 2023 (29.8 years).
Percent of Population Age 65 and Above, 2020
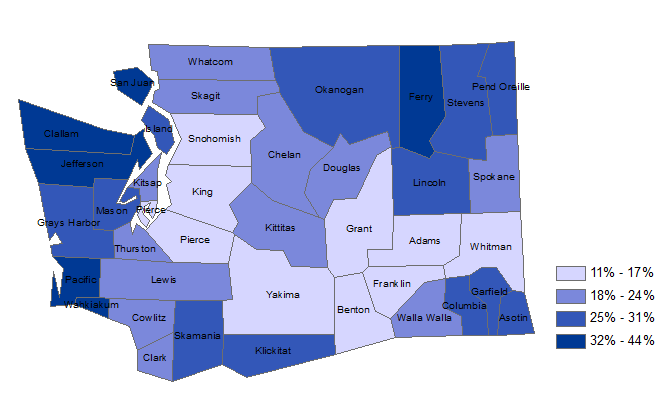
The age 65 and older population generally represents those nearing retirement.
In 2010, 12.3% of Washington state residents were 65 or older. In 2023, 17.5% Washington state residents were 65 and older.
Jefferson County had the highest share of the population age 65 and older in Washington state with 26.3% in 2010 and 43.5% in 2023.
Franklin County had the lowest share of population 65 and older with 7.3% in 2010 and 10.9% in 2023. Adams County has the second lowest percentages of population 65 and older, with 12.1% in 2023.
Percent of Population Age 85 and Above, 2020
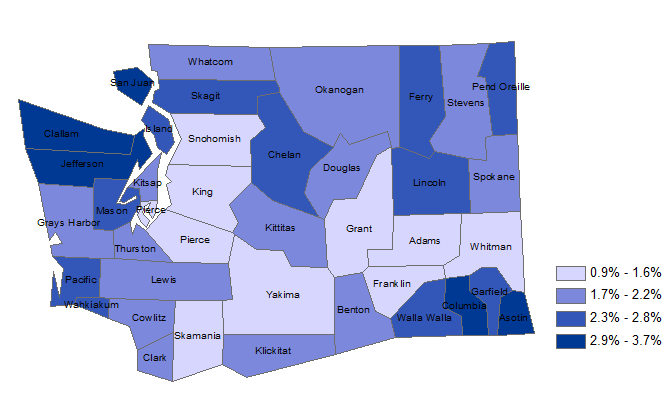
In 2010, 2022 and 2023, 1.7% of Washington state residents were age 85 or older.
Garfield County had the highest share of 85+ population in 2010 with 4.2%. In 2023, Jefferson had the highest shar of 85+ population with 3.7%
Franklin County had the lowest share of population 85+ in 2010 and in 2023 with 0.9%.
Data source
Population by race
Washington state population by race
2024
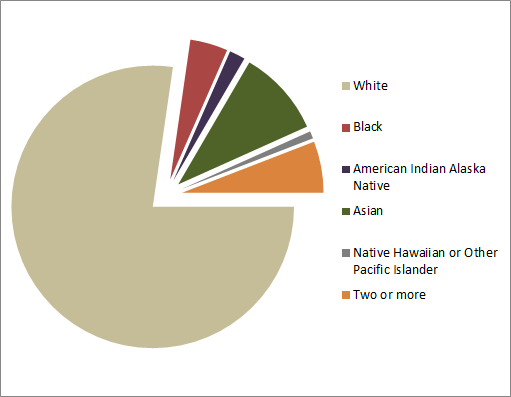
- Respondents to the federal census were allowed to check more than one race category for the first time in 2000 thus
allowing the tabulation of persons of multiple race. - Asian’s make up the largest minority racial group in 2024 with 9.9% of Washington’s total population.
- Non-white racial groups represented 22.7% of Washington’s population in 2024.
| Race | Population |
|---|---|
| Total | 8,024,630 |
| White | 6,201,549 |
| Black | 346,114 |
| American Indian Alaska Native | 145,066 |
| Asian | 793,054 |
| Native Hawaiian or other Pacific Islander | 67,687 |
| Two or more races | 471,160 |
Data source
Population change: natural increase and net migration
Washington state population
1990-2024
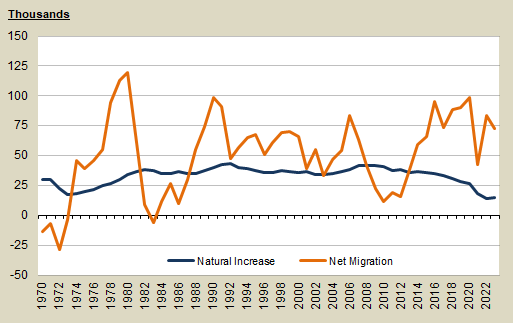
- Population change is comprised of two major components — natural increase and net migration.
- Natural increase (births minus deaths) is the more stable component of population change. Natural increase hit a nadir in 1973
when the number of births in the state fell to its lowest level in the post WWII era, a period commonly referred to as the “Baby Bust.” - Beginning in 2006, the children of the baby boomers started reaching childbearing age and the number of births in Washington began to increase. This high level of births, referred to by demographers as the “Third Wave” of the baby boom, was expected to hold for some time. Beginning in 2009, women started having fewer children in response to the recession and the slow pace of the economic recovery.
- In 2024, persons age 65 and over made up approximately 17.9% of the state’s population, up by 5.6% points since 2010. The increase of population aged 65 and older means a smaller share of the population will be women of child bearing age. At the same time, a larger proportion of the state’s population will be older and are thus at greater risk of dying.
At the same time, a larger proportion of the state’s population will be older and are thus at greater risk of dying. - Migration into and out of Washington is largely dependent upon the economic conditions within the state relative to the rest of the nation. The Boeing Bust of the late 1960s and early 1970s resulted in probably the greatest exodus of population in Washington history.
- The poor economic climate in California resulted in out-migration of about 400,000 people per year in the early 1990s. Even though Washington’s economic growth was slow during that period, it still outpaced California’s, thus serving as a magnet to many from the Golden State. More recent economic conditions, though hardly optimal, also favor Washington state relative to California.
| Year | Natural Increase | Net Migration |
|---|---|---|
| 2024 | 15,280 | 69,270 |
| 2023 | 14,445 | 72,305 |
| 2022 | 13,806 | 83,619 |
| 2021 | 18,122 | 42,543 |
| 2020 | 26,323 | 98,169 |
| 2019 | 28,503 | 89,836 |
| 2018 | 30,974 | 88,432 |
| 2017 | 33,589 | 73,265 |
| 2016 | 35,158 | 95,441 |
| 2015 | 35,631 | 65,780 |
| 2014 | 36,315 | 59,449 |
| 2013 | 36,141 | 38,055 |
| 2012 | 37,903 | 15,869 |
| 2011 | 37,597 | 19,340 |
| 2010 | 40,736 | 11,541 |
| 2009 | 41,722 | 22,307 |
| 2008 | 41,621 | 41,492 |
| 2007 | 41,591 | 63,311 |
| 2006 | 37,888 | 83,534 |
| 2005 | 36,236 | 54,029 |
| 2004 | 34,932 | 46,683 |
Data source
Population by county — census data (map)
Population, 2010
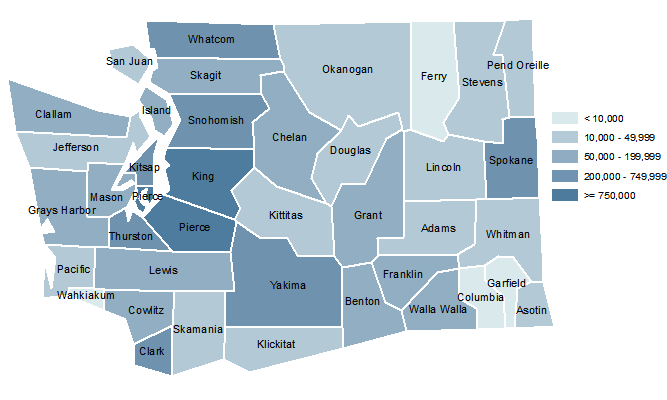
Population, 2000
Population Change, 2000–2010
Data source
Last modified: September 26, 2012
Population of Hispanic/Latino origin
As a Percent of Total Population
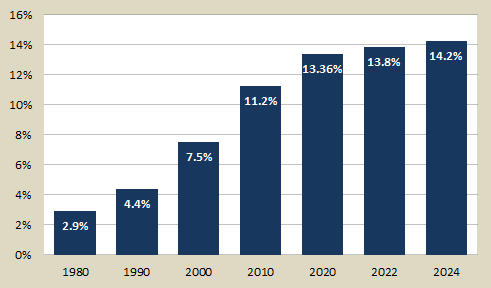
- The question on Spanish/Hispanic/Latino origin is separate from the question on race. Persons of Hispanic or Latino origin may be of any race.
- The 1980 and 1990 censuses asked people if they were of “Spanish/Hispanic origin or descent” and, if so, to choose Mexican, Puerto Rican, Cuban, or other Spanish/Hispanic.
- In Census 2000, people of Spanish/Hispanic/Latino origin could identify as Mexican, Puerto Rican, Cuban, or other Spanish/Hispanic/Latino.
- The term “Latino” appeared on the census form for the first time in 2000.
- The Hispanic/Latino population is increasing steadily in Washington, almost doubling during the 1990s and reaching 14.2% of the population by 2024.
- In 2023 Washington ranked 12th highest among the states in total Hispanic/Latino population and 16th in percent share of Hispanic/Latino population.
| Year | Population |
|---|---|
| 2024 | 1,143,900 |
| 2020 | 1,029,352 |
| 2010 | 755,790 |
| 2000 | 441,510 |
| 1990 | 214,570 |
| 1980 | 120,016 |
Data source
Total population and percent change
1990-2024
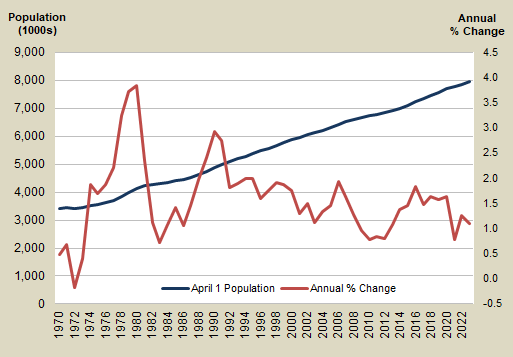
- The April 1, 2024, population estimate places Washington’s population at 8,035,700. This represents an increase of 84,550, or 1.05%, since last year.
- Washington’s annual rate of population growth had been below 1.0% from 2009 to 2013 due to the sluggish economy. Economic activity has a strong influence on net migration.
- Washington’s population has experienced wide swings in growth. One of the low-points of the post-war era came in 1972, in the aftermath of the Boeing-bust. Washington experienced a decline in population as ranks of unemployed aerospace workers and others sought gainful employment outside Washington state.
- A rebounding aircraft sector, and solid economic growth overall, resulted in record growth in 1980 when population expanded by 3.85%, a pace unmatched since.
| Year | April 1 Population | Annual Percent Change |
|---|---|---|
| 2024 | 8,035,700 | 1.05 |
| 2023 | 7,951,150 | 1.10 |
| 2022 | 7,864,400 | 1.26 |
| 2021 | 7,766,925 | 1.45 |
| 2020 | 7,656,200 | 1.45 |
| 2019 | 7,546,400 | 1.60 |
| 2018 | 7,427,570 | 1.60 |
| 2017 | 7,310,300 | 1.76 |
| 2016 | 7,183,700 | 1.73 |
| 2015 | 7,061,410 | 1.34 |
| 2014 | 6,968,170 | 1.25 |
| 2013 | 6,882,400 | 0.95 |
| 2012 | 6,817,770 | 0.74 |
| 2011 | 6,767,900 | 0.64 |
| 2010 | 6,724,540 | 0.79 |
| 2009 | 6,672,159 | 0.97 |
| 2008 | 6,608,245 | 1.27 |
| 2007 | 6,525,086 | 1.63 |
| 2006 | 6,420,258 | 1.93 |
| 2005 | 6,298,816 | 1.45 |
| 2004 | 6,208,515 | 1.33 |