Expenditures trends
In This Section
Corrections expenditures per $1,000 personal income
Washington State & Local Government Corrections Expenditures Per $1,000 Personal Income
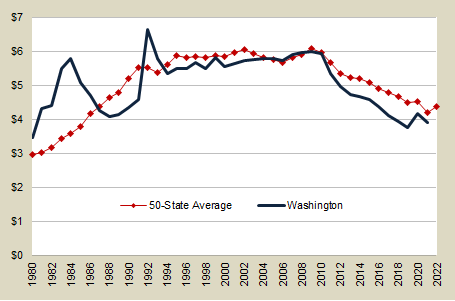
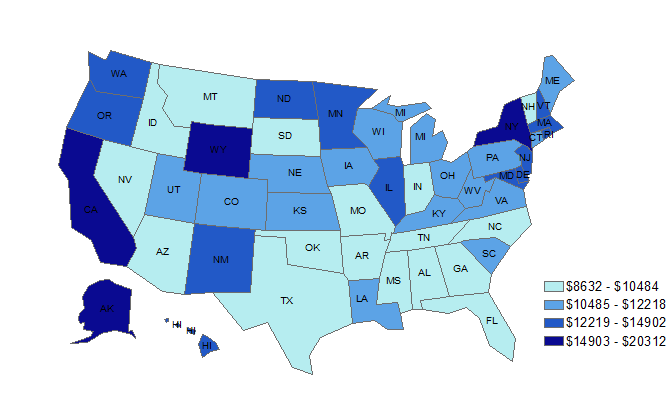
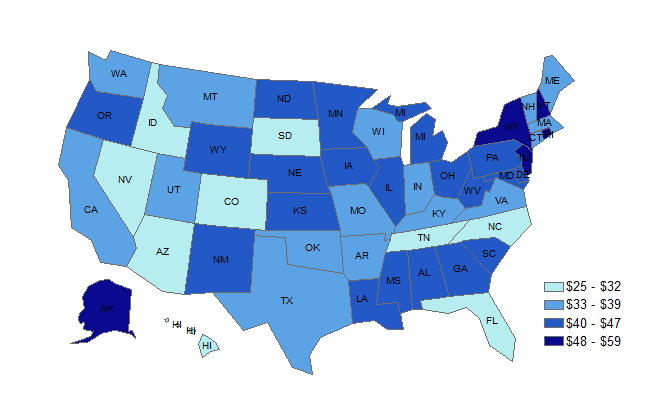
- In fiscal year 2022, Washington ranked 25th among the 50 states in state and local government corrections expenditures per $1,000 of personal income.
| Fiscal Year |
Expenditures Per $1,000 Personal Income |
|---|---|
| 2022 | $3.80 |
| 2021 | $3.90 |
| 2020 | $4.17 |
| 2019 | $3.75 |
| 2018 | $3.95 |
| 2017 | $4.11 |
| 2016 | $4.39 |
| 2015 | $4.59 |
| 2014 | $4.67 |
| 2013 | $4.73 |
| 2012 | $4.98 |
| 2011 | $5.36 |
| 2010 | $5.93 |
| 2009 | $5.99 |
| 2008 | $5.98 |
| 2007 | $5.92 |
| 2006 | $5.73 |
| 2005 | $5.80 |
| 2004 | $5.79 |
| 2003 | N/A |
| 2002 | $5.74 |
Data sources
- U.S. Census Bureau: State and Local Government Finances
- U.S. Bureau of Economic Analysis (personal income)
E-mail: OFM.Forecasting@ofm.wa.gov
Comparing the states: state & local government corrections expenditures per $1,000 personal income
2022
Related data
Data sources
Corrections expenditures per capita
Washington State & Local Government Corrections Expenditures Per Capita
Inflation-Adjusted to 2022 Dollars
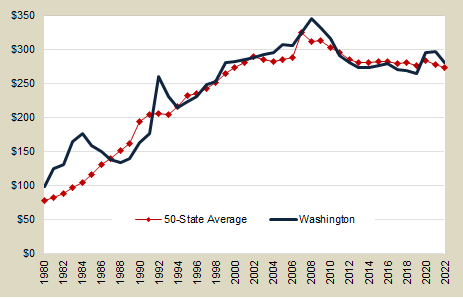
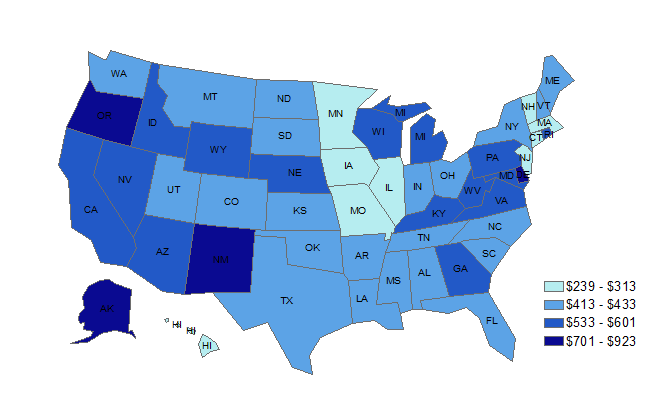
- In fiscal year 2022, Washington ranked 15th among the 50 states in per capita expenditures on corrections.
| Fiscal Year | Expenditures Per Capita |
|---|---|
| 2022 | $281 |
| 2021 | $297 |
| 2020 | $296 |
| 2019 | $264 |
| 2018 | $273 |
| 2017 | $274 |
| 2016 | $280 |
| 2015 | $277 |
| 2014 | $273 |
| 2013 | $274 |
| 2012 | $281 |
| 2011 | $292 |
| 2010 | $317 |
| 2009 | $332 |
| 2008 | $346 |
| 2007 | $325 |
| 2006 | $306 |
| 2005 | $308 |
| 2004 | $296 |
| 2003 | NA |
| 2002 | $288 |
Data sources
Comparing the states: state & local government corrections expenditures per capita
2022
Related data
Data sources
Expenditures per $1,000 personal income
Washington state & local government expenditures per $1,000 personal income
State & Local Government
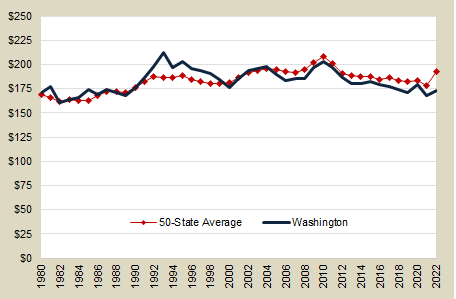
- Since fiscal year 2000, Washington’s average direct general expenditures per $1,000 personal income have approximated the 50 state average.
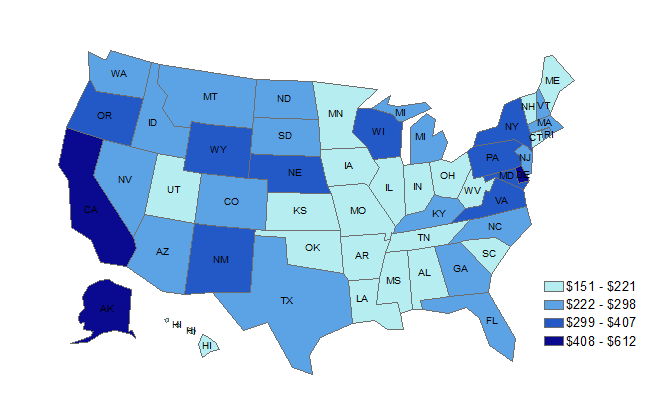
- In fiscal year 2022, Washington ranked 36th among the 50 states in total state and local government expenditures per $1,000 of personal income.
- Expenditure Definition: All amounts of money paid out by a government–net of recoveries and other correcting transactions–other than for retirement of debt, investment in securities, extension of credit, or as agency transactions. Note that expenditure includes only external transactions of a government and excludes non-cash transactions such as the provision of perquisites or other payments in kind.
| Fiscal Year | Expenditures per $1,000 personal income |
|---|---|
| 2022 | $173.03 |
| 2021 | $167.76 |
| 2020 | $178.96 |
| 2019 | $170.67 |
| 2018 | $174.15 |
| 2017 | $177.13 |
| 2016 | $179.19 |
| 2015 | $182.18 |
| 2014 | $180.54 |
| 2013 | $179.99 |
| 2012 | $186.37 |
| 2011 | $197.29 |
| 2010 | $203.12 |
| 2009 | $196.98 |
| 2008 | $185.06 |
| 2007 | $185.27 |
| 2006 | $183.02 |
| 2005 | $189.98 |
| 2004 | $197.42 |
| 2003 | N/A |
| 2002 | $193.56 |
Data sources
Comparing the states: state & local government expenditures per $1,000 personal income
Direct General Expenditures, 2022
Related data
Data sources
Higher education expenditures per $1,000 personal income
Washington State & Local Government Higher Education Expenditures Per $1,000 Personal Income
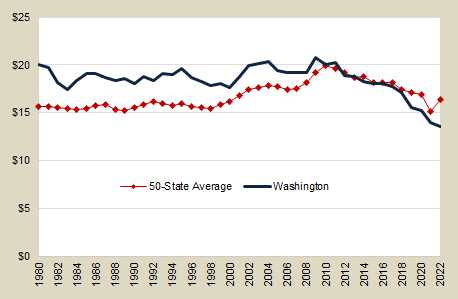
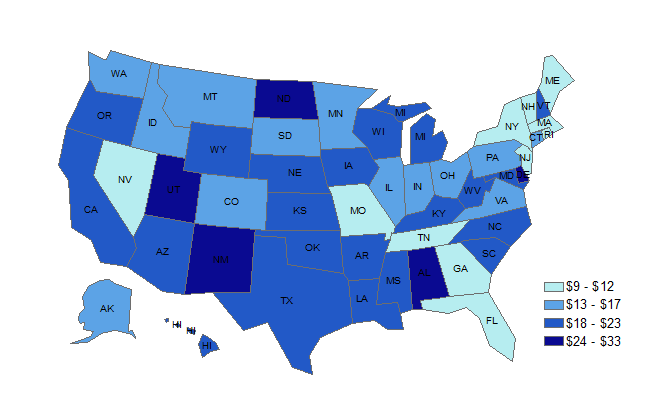
- Washington government spending on higher education relative to personal income has consistently been above the U.S. average.
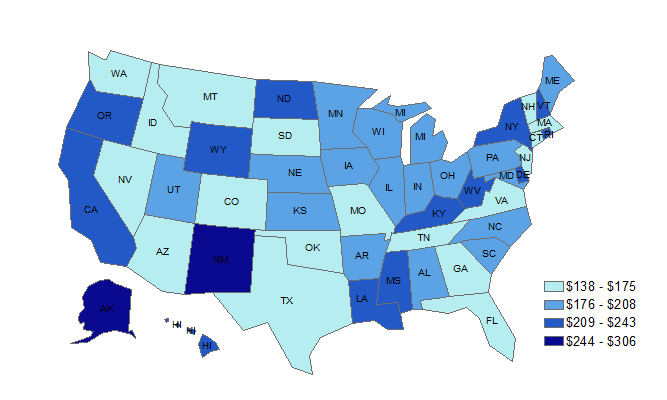
- In fiscal year 2022, Washington ranked 36th among the states in state and local government higher education spending per $1,000 of personal income.
| Fiscal Year | Expenditures Per $1,000 Personal Income |
|---|---|
| 2022 | $13.59 |
| 2021 | $13.94 |
| 2020 | $15.28 |
| 2019 | $15.50 |
| 2018 | $17.12 |
| 2017 | $17.74 |
| 2016 | $18.02 |
| 2015 | $18.01 |
| 2014 | $18.30 |
| 2013 | $18.82 |
| 2012 | $18.84 |
| 2011 | $20.24 |
| 2010 | $20.00 |
| 2009 | $20.75 |
| 2008 | $19.22 |
| 2007 | $19.18 |
| 2006 | $19.23 |
| 2005 | $19.39 |
| 2004 | $20.33 |
| 2003 | N/A |
| 2002 | $19.95 |
Data sources
Comparing the states: state & local government higher education expenditures per $1,000 personal income
2022
Related data
Data sources
Higher education expenditures per capita
Washington State & Local Government Higher Education Expenditures Per Capita
Inflation-Adjusted to 2022 Dollars
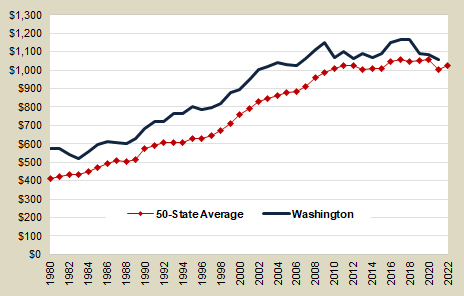
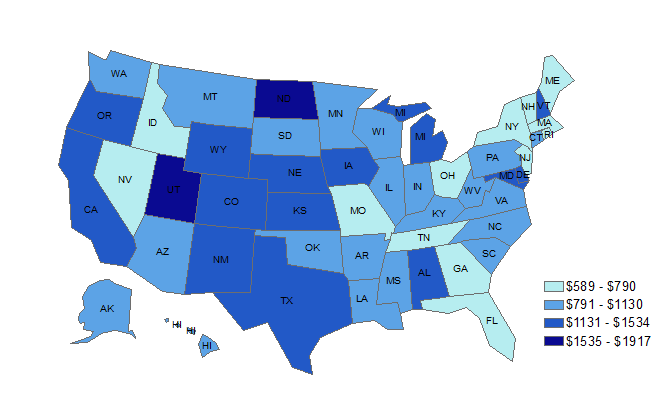
- Washington government per capita spending on higher education has consistently been above the U.S. average.
- In fiscal year 2022, Washington ranked 24th among the 50 states in per capita state and local government spending on higher education.
| Fiscal Year | Expenditures Per Capita |
|---|---|
| 2022 | $1,006 |
| 2021 | $1,060 |
| 2020 | $1,085 |
| 2019 | $987 |
| 2018 | $1,167 |
| 2017 | $1,168 |
| 2016 | $1,149 |
| 2015 | $1,089 |
| 2014 | $1,069 |
| 2013 | $1,090 |
| 2012 | $1,064 |
| 2011 | $1,101 |
| 2010 | $1,067 |
| 2009 | $1,152 |
| 2008 | $1,111 |
| 2007 | $1,062 |
| 2006 | $1,062 |
| 2005 | $1,029 |
| 2004 | $1,039 |
| 2003 | N/A |
| 2002 | $1,002 |
Data sources
Comparing the states: state & local government higher education expenditures per capita
2022
Related data
Data sources
K-12 education expenditures per $1,000 personal income
Washington state & local government K-12 education expenditures per $1,000 personal income
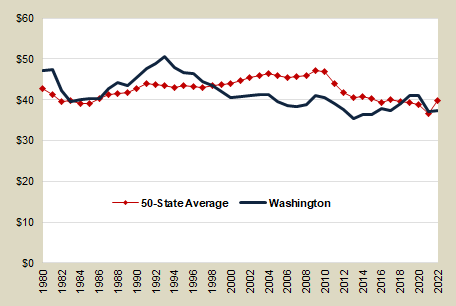
- In fiscal year 2022, Washington ranked 32nd among the states in state and local government K-12 education spending per $1,000 of personal income.
| Fiscal Year | Expenditures per $1,000 personal income |
|---|---|
| 2022 | $37.39 |
| 2021 | $37.15 |
| 2020 | $40.96 |
| 2019 | $41.07 |
| 2018 | $39.08 |
| 2017 | $37.43 |
| 2016 | $37.76 |
| 2015 | $36.37 |
| 2014 | $36.29 |
| 2013 | $35.32 |
| 2012 | $37.54 |
| 2011 | $39.00 |
| 2010 | $40.64 |
| 2009 | $41.08 |
| 2008 | $38.81 |
| 2007 | $38.43 |
| 2006 | $38.67 |
| 2005 | $39.54 |
| 2004 | $41.36 |
| 2003 | N/A |
| 2002 | $41.02 |
Data sources
Comparing the states: state & local government K-12 education expenditures per $1,000 personal income
2022
Related Data
Data sources
K-12 education expenditures per capita
Washington state & local government K-12 education expenditures per capita
Inflation-Adjusted to 2022 Dollars
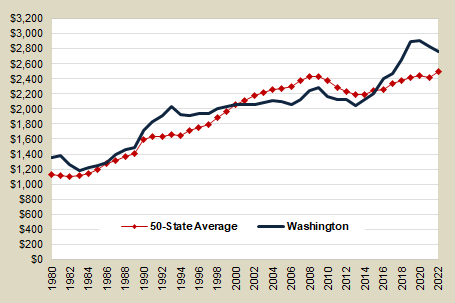
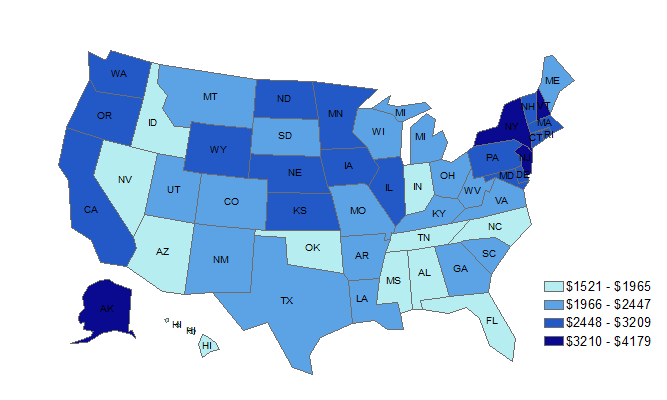
- In 2000, Washington ranked 15th among the states in state and local government K-12 education spending per capita. In fiscal year 2022 Washington was ranked 12th.
| Fiscal Year | Expenditures Per Capita (Inflation-Adjusted to 2020 Dollars) |
|---|---|
| 2022 | $2,769 |
| 2021 | $2,852 |
| 2020 | $2,908 |
| 2019 | $2,891 |
| 2018 | $2,663 |
| 2017 | $2,465 |
| 2016 | $2,408 |
| 2015 | $2,200 |
| 2014 | $2,120 |
| 2013 | $2,045 |
| 2012 | $2,119 |
| 2011 | $2,122 |
| 2010 | $2,168 |
| 2009 | $2,280 |
| 2008 | $2,242 |
| 2007 | $2,128 |
| 2006 | $2,063 |
| 2005 | $2,099 |
| 2004 | $2,114 |
| 2003 | N/A |
| 2002 | $2,062 |
Data sources
Comparing the states: state & local government K-12 education expenditures per capita
2022
Related data
Data sources
State & local government expenditures by function
Washington state & local government expenditures, Fiscal Year 2022
Fiscal Year 2022
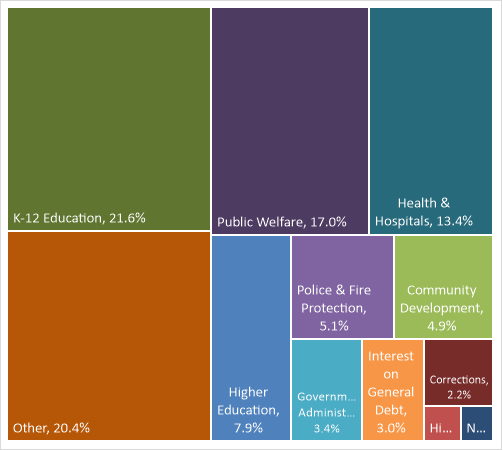
- About half of state and local government expenditures are driven by education enrollments, and public welfare and corrections caseloads
($ millions)
| Category | Expenditures |
|---|---|
| K-12 Education | $21,498 |
| Public Welfare | $16,948 |
| Health and Hospitals | $13,291 |
| Higher Education | $7,812 |
| Governmental Administration | $610 |
| Highways | $4,881 |
| Housing, Com Dev., Sewerage, Solid Waste | $3,401 |
| Interest on General Debt | $2,999 |
| Natural Resources, Parks & Recreation | $534 |
| Correction | $2,184 |
| Police & Fire Protection | $5,064 |
| Other | $20,264 |
| Total | $99,486 |
- .
Data source
State & local government expenditures per capita
Washington state & local government expenditures per capita
Inflation-Adjusted to 2022 Dollars
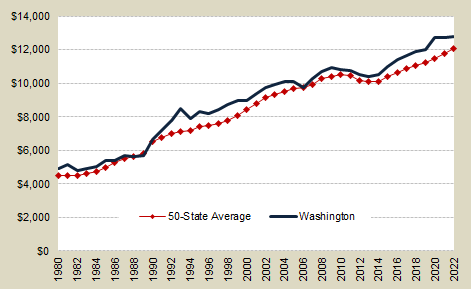
- Washington state and local government direct general expenditures per capita have generally been higher than the average for the U.S.
- In fiscal year 2022, Washington ranked 15th among the states in per capita state and local government expenditures.
- Periods where Washington’s per capita government expenditures are not above average tend to be those in which elevated economic activity in Washington has resulted in high in-migration and fast population growth.
| Fiscal Year | Expenditures Per Capita (Inflation-Adjusted to 2021 Dollars) |
|---|---|
| 2022 | $12,816 |
| 2021 | $12,758 |
| 2020 | $12,708 |
| 2019 | $12,011 |
| 2018 | $11,866 |
| 2017 | $11,664 |
| 2016 | $11,426 |
| 2015 | $11,017 |
| 2014 | $10,547 |
| 2013 | $10,423 |
| 2012 | $10,519 |
| 2011 | $10,736 |
| 2010 | $10,838 |
| 2009 | $10,932 |
| 2008 | $10,693 |
| 2007 | $10,257 |
| 2006 | $9,766 |
| 2005 | $10,084 |
| 2004 | $10,090 |
| 2003 | N/A |
| 2002 | $9,729 |
Data sources
Comparing the states: state & local government expenditures per capita
Direct General Expenditures, 2022