


Revenue trends
In This Section
State & local government revenue sources
Washington state & local government revenue sources, Fiscal Year 2022
Fiscal Year 2022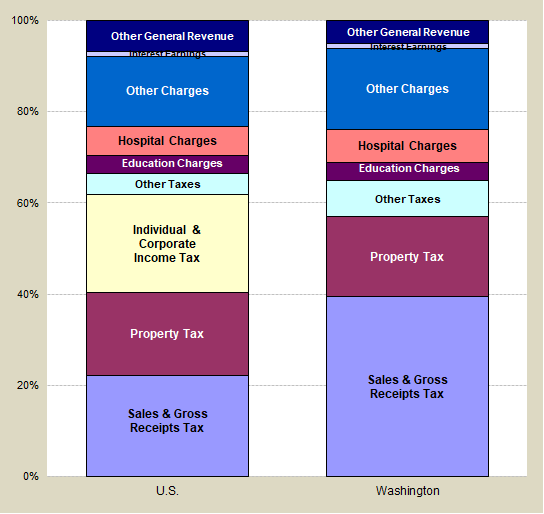
- Washington is slightly more dependent on charges for services than the U.S. average.
- Washington is one of a few states without personal or corporate income taxes.
- Washington depends more heavily on excise taxes, including the general sales & use tax, selective sales taxes, and the gross receipts tax (business & occupation tax) than most any other state.
- Washington is the only state with a general gross receipts tax – the Business & Occupation Tax.
($ millions)
| Source | Amount |
|---|---|
| Sales & Gross Receipts Tax | $35,181 |
| Property Tax | $15,530 |
| Individual & Corporate Income Tax | $0 |
| Other Taxes | $7,023 |
| Education Charges | $3,583 |
| Hospital Charges | $6,469 |
| Other Charges | $15,779 |
| Interest Earnings | $891 |
| Other General Revenue | $4,523 |
| Total | $88,979 |
Data source
E-mail: OFM.Forecasting@ofm.wa.gov
State & local government revenues per $1,000 personal income
Washington state & local government revenues per 1,000 personal income
Revenues per $1,000 personal income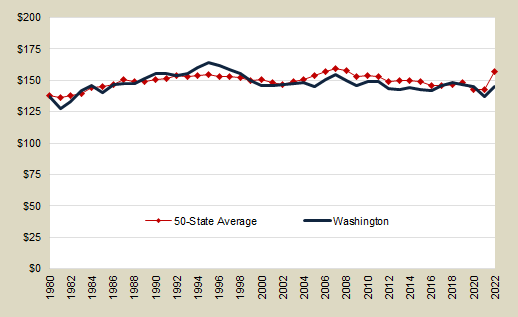
- Revenues include fees, charges for services, and interest earnings as well as taxes. See State & Local Government Revenue Sources for a breakdown of revenues into individual sources.
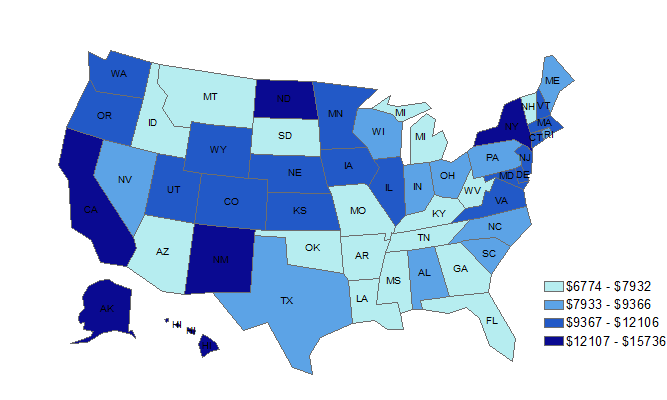
- In fiscal year 2022, Washington ranked 30th among the 50 states in state and local government revenues per $1,000 of personal income.
- Revenue Definition – All amounts of money received by a government from external sources–net of refunds and other correcting transactions–other than from issuance of debt, liquidation of investments, and as agency and private trust transactions. Note that revenue excludes noncash transactions such as receipt of services, commodities, or other “receipts in kind.”
| Fiscal Year | Revenues per $1,000 personal income |
|---|---|
| 2022 | $145.34 |
| 2021 | $136.87 |
| 2020 | $145.25 |
| 2019 | $146.57 |
| 2018 | $148.29 |
| 2017 | $145.53 |
| 2016 | $142.08 |
| 2015 | $142.91 |
| 2014 | $144.11 |
| 2013 | $142.68 |
| 2012 | $143.47 |
| 2011 | $148.90 |
| 2010 | $148.68 |
| 2009 | $145.45 |
| 2008 | $149.77 |
| 2007 | $154.45 |
| 2006 | $150.86 |
| 2005 | $145.33 |
| 2004 | $148.46 |
| 2003 | N/A |
| 2002 | $146.77 |
Data sources
- U.S. Census Bureau: State and Local Government Finances
- U.S. Bureau of Economic Analysis (personal income)
E-mail: OFM.Forecasting@ofm.wa.gov
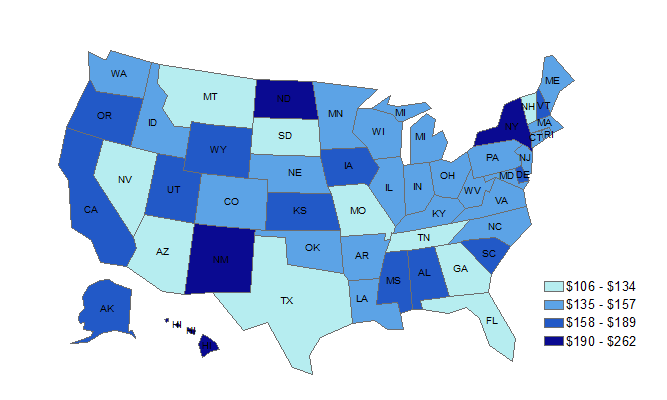
Comparing the states: state & local revenues per $1,000 personal income
2022
Related data
Data sources
- U.S. Census Bureau: State and Local Government Finances
- U.S. Bureau of Economic Analysis (personal income)
E-mail: OFM.Forecasting@ofm.wa.gov
State & local government revenues per capita
Washington state & local government revenues per capita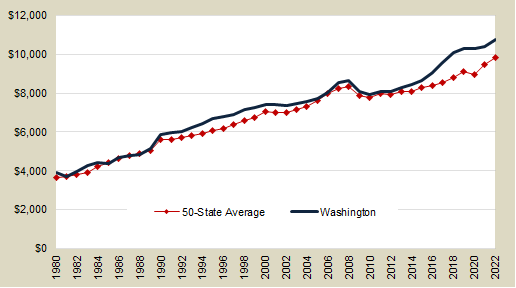
- Revenues include fees, charges for services, and interest earnings as well as taxes. See State & Local Government Revenue Sources for a breakdown of revenues into individual sources.
- In fiscal year 2022, Washington ranked 12th among the 50 states in state and local government revenues per capita.
Inflation-Adjusted to 2022 Dollars
| Fiscal Year | Revenues Per Capita (Inflation-Adjusted to 2021 Dollars) |
|---|---|
| 2022 | $10,765 |
| 2021 | $10,409 |
| 2020 | $10,314 |
| 2019 | $10,315 |
| 2018 | $10,104 |
| 2017 | $9,584 |
| 2016 | $9,060 |
| 2015 | $9,642 |
| 2014 | $8,419 |
| 2013 | $8,262 |
| 2012 | $8,098 |
| 2011 | $8,102 |
| 2010 | $7,933 |
| 2009 | $8,072 |
| 2008 | $8,654 |
| 2007 | $8,551 |
| 2006 | $8,050 |
| 2005 | $7,714 |
| 2004 | $7,588 |
| 2003 | NA |
| 2002 | $7,377 |
Data sources
E-mail: OFM.Forecasting@ofm.wa.gov
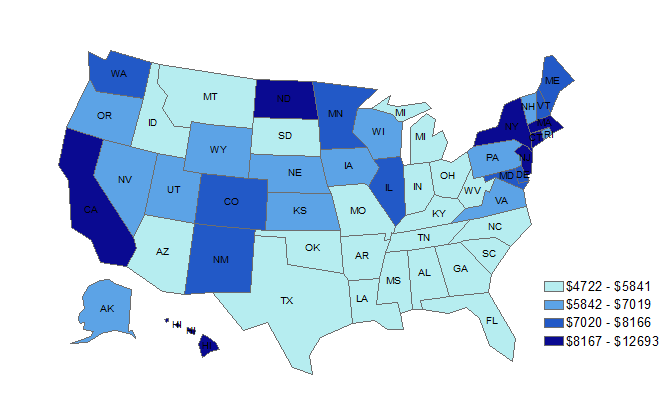
Comparing the states: state & local revenues per capita
2022
Related data
Data sources
- U.S. Census Bureau: State and Local Government Finances
- U.S. Census Bureau: National and State Population Estimates
E-mail: OFM.Forecasting@ofm.wa.gov
State & local taxes per $1,000 personal income
Washington state & local government taxes per $1,000 personal income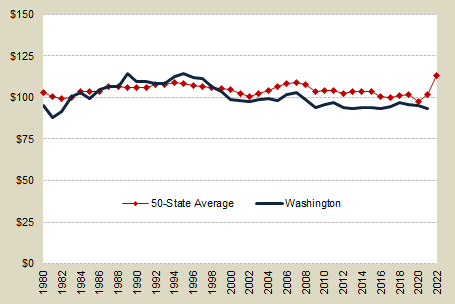
- Between 1995 and 2022 Washington’s rank among the 50 states in state and local taxes per $1,000 of personal income fell from 11th to 32nd.
- In 2000, Washington’s state and local taxes per $1,000 of personal income dipped below the average of all the states for the first time since 1985.
- In the 2003-2007 period, the ready availability of consumer credit and a quickly appreciating housing market helped spur consumer spending, resulting in a rebound in taxes relative to personal income.
- A combination of higher-than-average personal income growth, a state spending limit holding down expenditures, and tax cuts through the legislative and initiative processes, pushed taxes down beginning in 1995.
- State comparisons of state & local taxes relative to personal income are available from the Washington Department of Revenue’s Comparative State and Local Taxes.
| Fiscal Year | Taxes per $1,000 personal income |
|---|---|
| 2022 | $100.41 |
| 2021 | $93.43 |
| 2020 | $95.05 |
| 2019 | $95.47 |
| 2018 | $97.00 |
| 2017 | $94.26 |
| 2016 | $93.34 |
| 2015 | $93.62 |
| 2014 | $93.80 |
| 2013 | $93.13 |
| 2012 | $93.99 |
| 2011 | $97.01 |
| 2010 | $95.75 |
| 2009 | $94.06 |
| 2008 | $98.73 |
| 2007 | $103.09 |
| 2006 | $101.97 |
| 2005 | $98.39 |
| 2004 | $99.34 |
| 2003 | N/A |
| 2002 | $97.73 |
Data sources
- U.S. Census Bureau: State and Local Government Finances
- U.S. Bureau of Economic Analysis (personal income)
E-mail: OFM.Forecasting@ofm.wa.gov
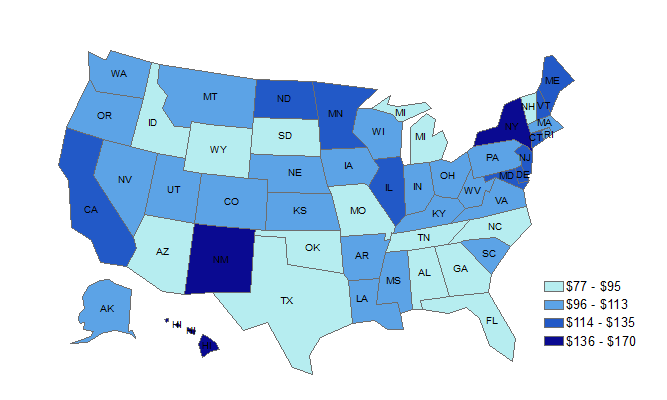
Comparing the states: state & local taxes per $1,000 personal income
2022
Related data
Data sources
- U.S. Census Bureau: State and Local Government Finances
- U.S. Bureau of Economic Analysis (personal income)
E-mail: OFM.Forecasting@ofm.wa.gov
State & local government taxes per capita
Washington state & local government taxes per capita
Inflation-Adjusted to 2022 Dollars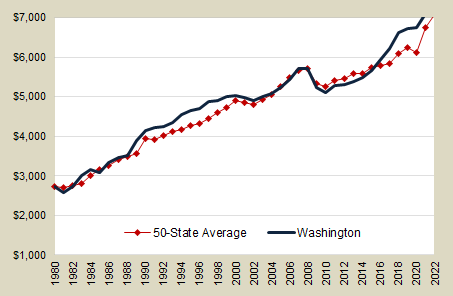
- In fiscal year 2022, Washington ranked 14th among the 50 states in total state and local taxes per capita.
- In fiscal year 2022, Washington ranked 1st in per capita state and local sales tax collections among all states, just behind Hawaii, highlighting Washington’s heavy dependence on general and selective sales taxes in its tax structure.
- Of the 13 western states, Washington ranked 4th in per capita state and local taxes in fiscal year 2022. California and Hawaii had higher per capita state and local taxes.
- State comparisons of state & local taxes per capita are available from the Washington Department of Revenue’s Comparative State and Local Taxes.
| Fiscal Year | Taxes per capita (Inflation-Adjusted to 2018 Dollars) |
|---|---|
| 2022 | $7,437 |
| 2021 | $7,105 |
| 2020 | $6,750 |
| 2019 | $6,719 |
| 2018 | $6,610 |
| 2017 | $6,207 |
| 2016 | $5,952 |
| 2015 | $5,661 |
| 2014 | $5,480 |
| 2013 | $5,393 |
| 2012 | $5,305 |
| 2011 | $5,279 |
| 2010 | $5,109 |
| 2009 | $5,220 |
| 2008 | $5,705 |
| 2007 | $5,705 |
| 2006 | $5,441 |
| 2005 | $5,222 |
| 2004 | $5,077 |
| 2003 | NA |
| 2002 | $4,912 |
Data sources
E-mail: OFM.Forecasting@ofm.wa.gov
Comparing the states: state & local taxes per capita
2022
Related data
Data sources
- U.S. Census Bureau: State and Local Government Finances
- U.S. Census Bureau: National and State Population Estimates
E-mail: OFM.Forecasting@ofm.wa.gov