Components of population change
2010–2023
| Population | |
|---|---|
| 2010 Population | 6,724,540 |
| Plus Births | 1,123,786 |
| Less Deaths | -739,279 |
| Plus Net Migration | 842,103 |
| =2023 Population | 7,951,150 |
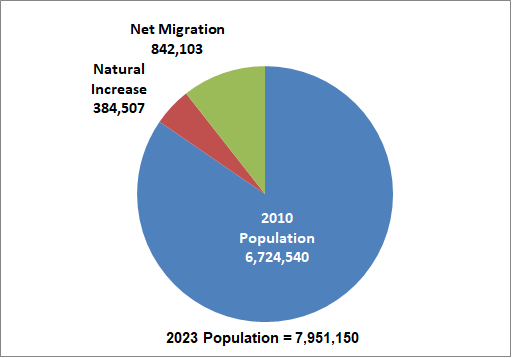
- The natural increase in population -- births less deaths -- has accounted for about 31.3% of the state's growth between 2010 and 2023.
- Net migration -- people moving in less people moving out -- has accounted for about 68.7% of Washington's population growth between 2010 and 2023.
2000–2010
| Population | |
|---|---|
| 2000 Population | 5,894,143 |
| Plus Births | 842,082 |
| Less Deaths | 463,516 |
| Plus Net Migration | 451,831 |
| =2010 Population | 6,724,540 |
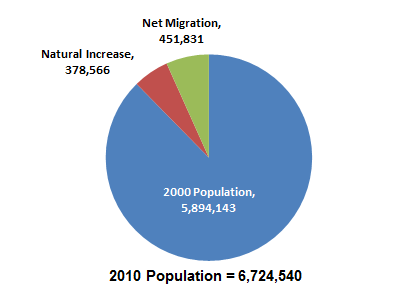
- The natural increase in population -- births less deaths -- has accounted for about 45.6 percent of the state's growth between 2000 and 2010.
- Net migration -- people moving in less people moving out -- has accounted for about 54.4 percent of Washington's population growth between 2000 and 2010.
1990–2000
| Population | |
|---|---|
| 1990 Population | 4,866,663 |
| Plus Births | 787,518 |
| Less Deaths | 404,816 |
| Plus Net Migration | 644,778 |
| =2000 Population | 5,894,143 |
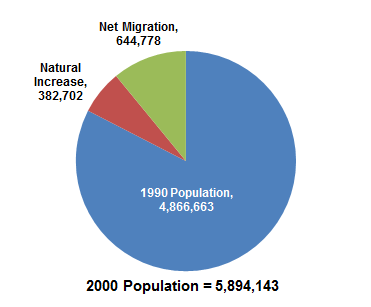
- The natural increase in population -- births less deaths -- accounted for about 37 percent of the state's growth between 1990 and 2000.
- Approximately 63 percent of Washington's population growth between 1990 and 2000 was due to net migration - more people moving in than moving out.
Data source:
E-mail: OFM.Forecasting@ofm.wa.gov
Last updated
Thursday, December 14, 2023
