Juvenile rehabilitation institutional population
| Fiscal Year |
Average Monthly Population |
|---|---|
| 2023 | 332 |
| 2022 | 324 |
| 2021 | 390 |
| 2020 | 405 |
| 2019 | 415 |
| 2018 | 486 |
| 2017 | 487 |
| 2016 | 483 |
| 2015 | 438 |
| 2014 | 533 |
| 2013 | 550 |
| 2012 | 566 |
| 2011 | 611 |
| 2010 | 704 |
| 2009 | 707 |
| 2008 | 779 |
| 2007 | 827 |
| 2006 | 829 |
| 2005 | 905 |
| 2004 | 925 |
| 2003 | 969 |
Compared to Age 12 to 17 Population
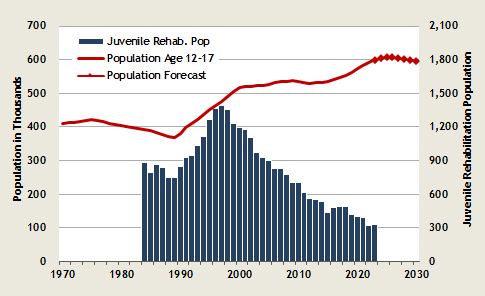
- The decrease in juvenile rehabilitation institutional population reflects, in part, the decline in juvenile arrests for violent crimes over the past two decades.
- Additionally, evolving legislation required that older juveniles charged with serious violent offenses be tried as adults, though their sentences may be different from adults. This shifted some of the juveniles who would have been committed to Juvenile Rehabilitation facilities to the jurisdiction of the Department of Corrections.
Data sources:
E-mail: OFM.Forecasting@ofm.wa.gov
Last updated
Tuesday, February 13, 2024
