Small area estimates program
Small Area Estimates Program (SAEP) estimates are meant to provide a consistent set of small area population and housing data for statewide applications. SAEP estimates are generated for census areas and other areas of statewide significance.
Before using the SAEP estimates, please see the SAEP User Guide to gain a better understanding of the data and methods behind the estimates as well as limitations in their use. For more specific information about the 2024 data release, please see the User Notes and Errata document.
Please note that SAEP estimates are NOT the official state population estimates used for revenue distribution and program administration related to cities and counties. Users interested in city and county estimates should see the state's official April 1 population estimates program.
Estimates for 2020 census areas
| Summary Level | Table | GIS Shapefile |
KML File |
Preview | Metadata |
|---|---|---|---|---|---|
| Census blocks | - | 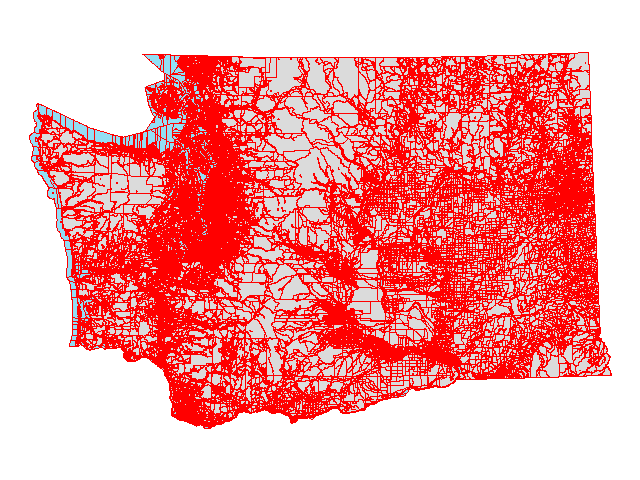 |
|||
| Census block groups | 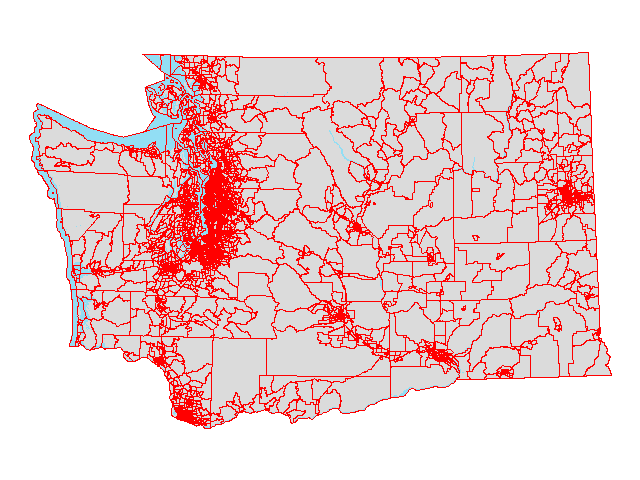 |
||||
| Census designated places | 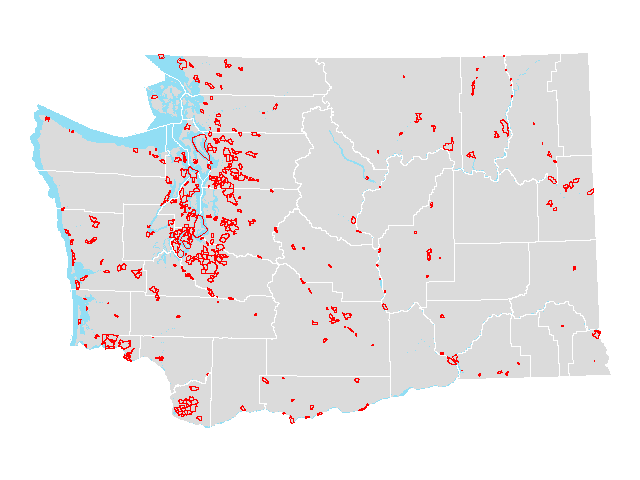 |
||||
| Census tracts |  |
||||
| Congressional districts [2022] | 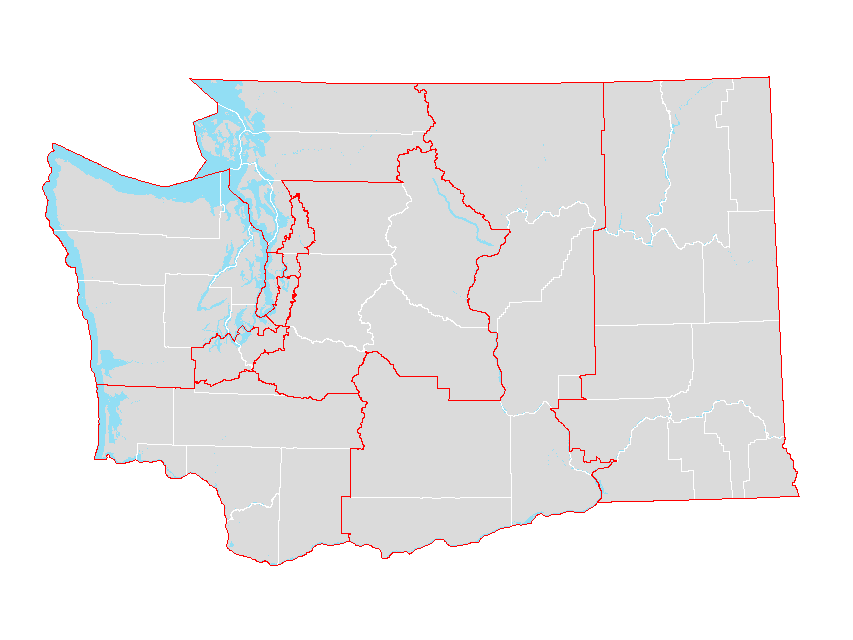 |
||||
| Congressional districts [2022] (county parts) | - | 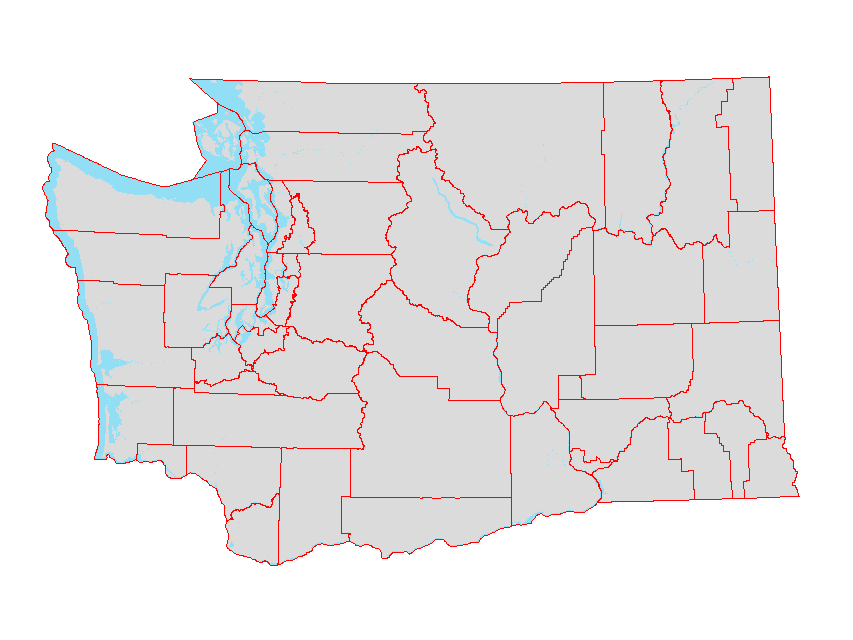 |
|||
| Counties | - | 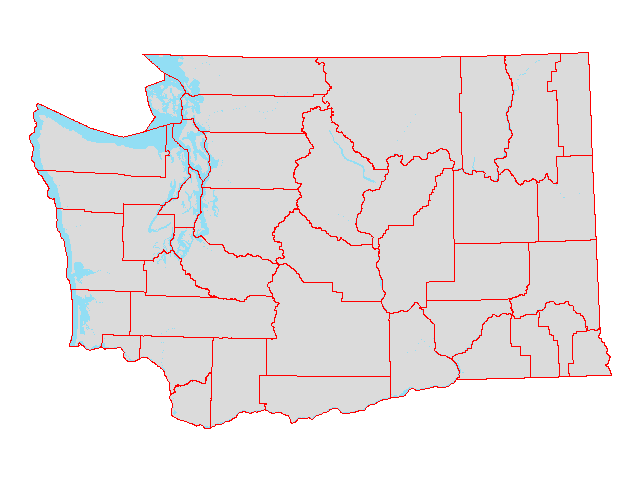 |
|||
| Public Use Microdata Areas (PUMA) | 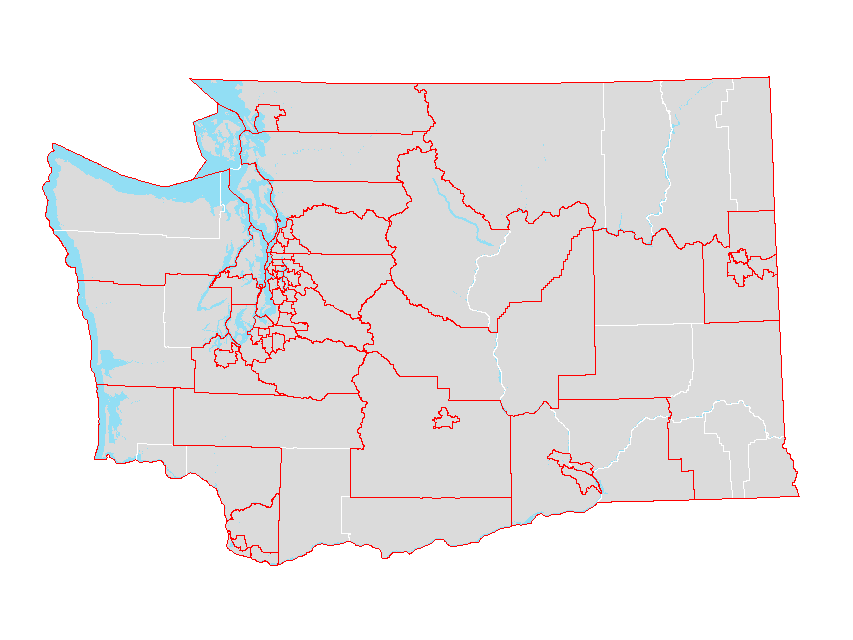 |
||||
| School districts | 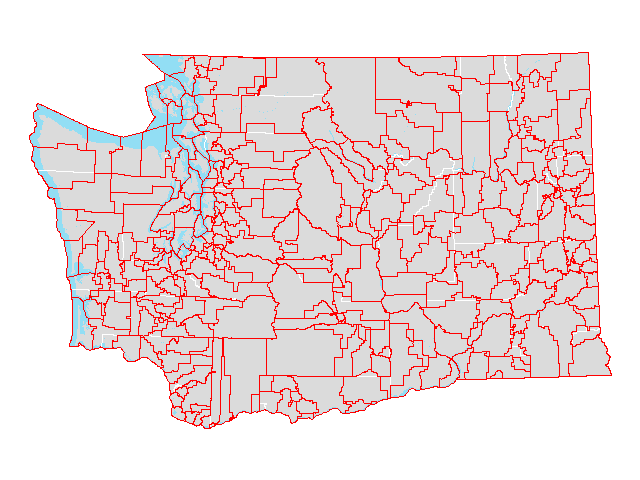 |
||||
| School districts (county parts) | - | 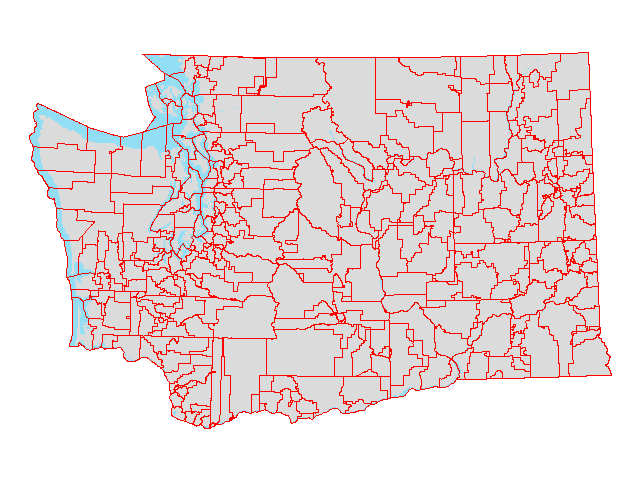 |
|||
| State | - | 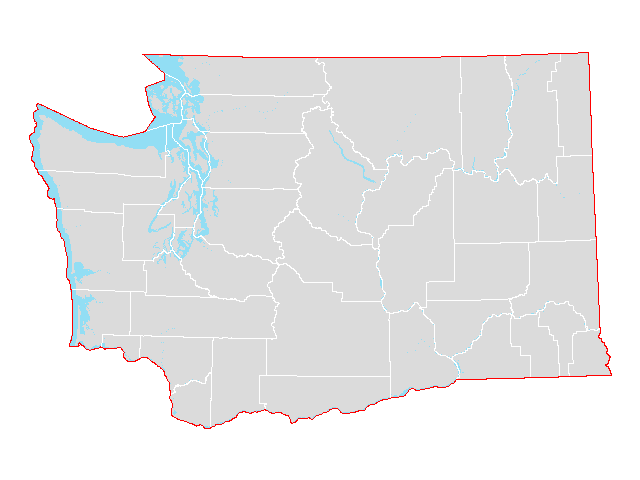 |
|||
| State legislative districts [2024] |  |
||||
| State legislative districts [2024] (county parts) |  |
||||
| State legislative districts [2022] | 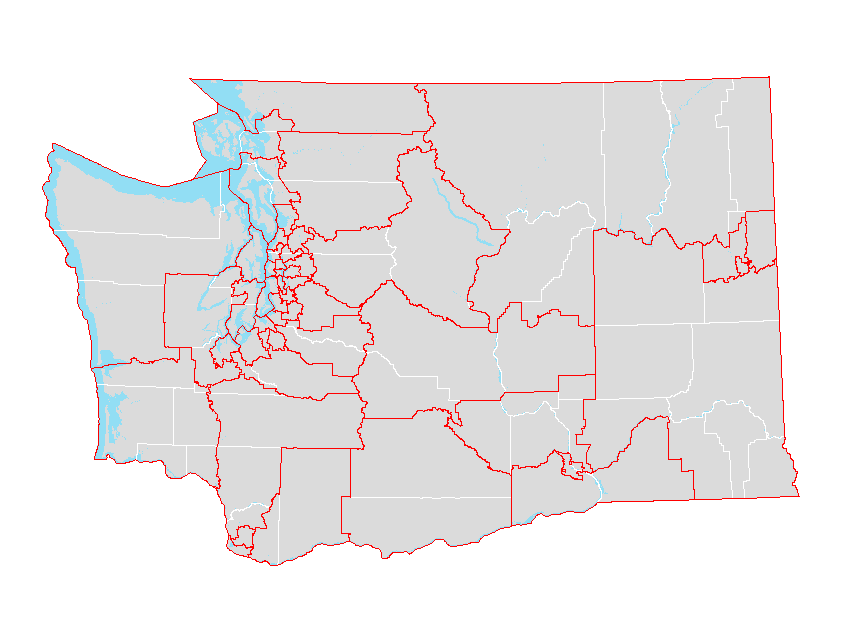 |
||||
| State legislative districts [2022] (county parts) | - | 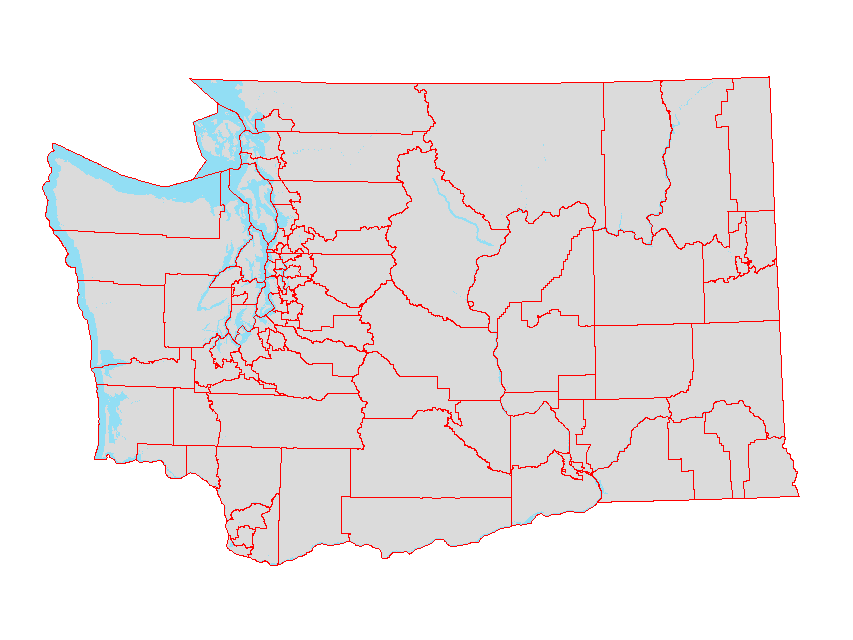 |
|||
| Tribal areas | 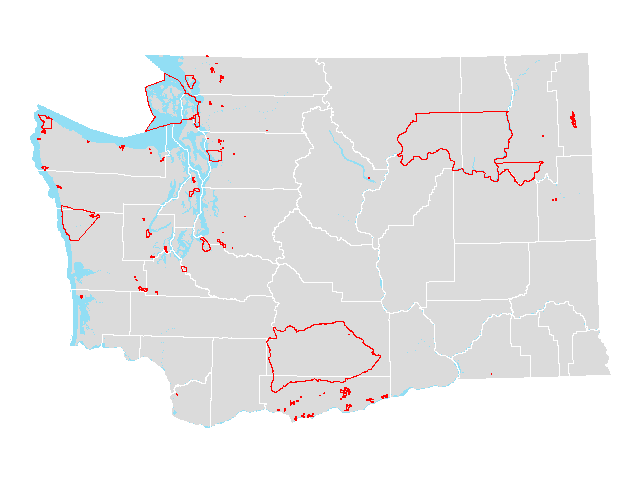 |
||||
| Urban Area | 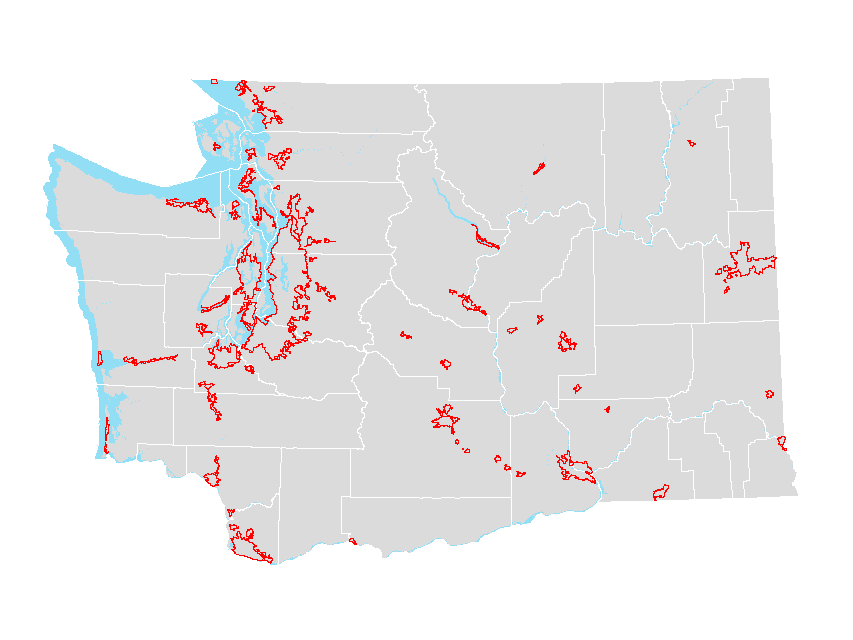 |
||||
| Urban Area (county parts) | - |  |
|||
| Urban growth areas |  |
||||
| Urban growth areas (county parts) | - | 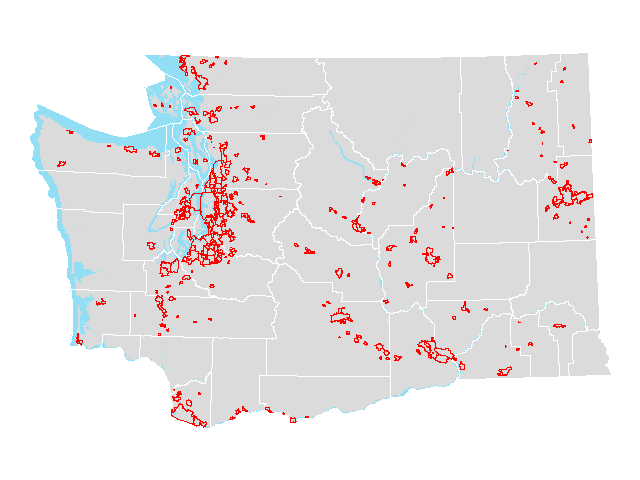 |
|||
| Voting Precincts [2020] | - | 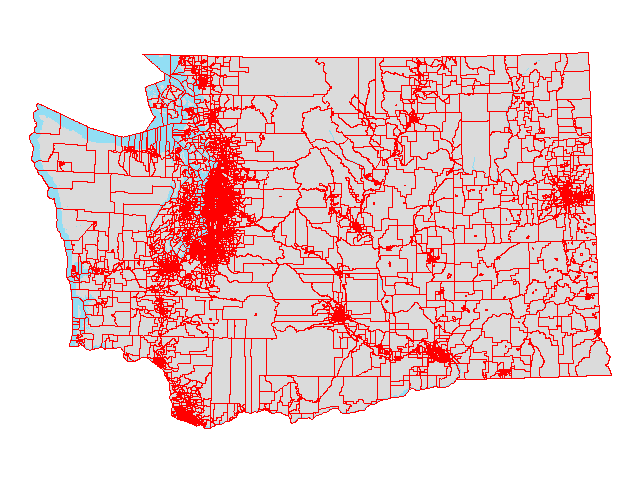 |
|||
| ZIP Code Tabulation Areas | 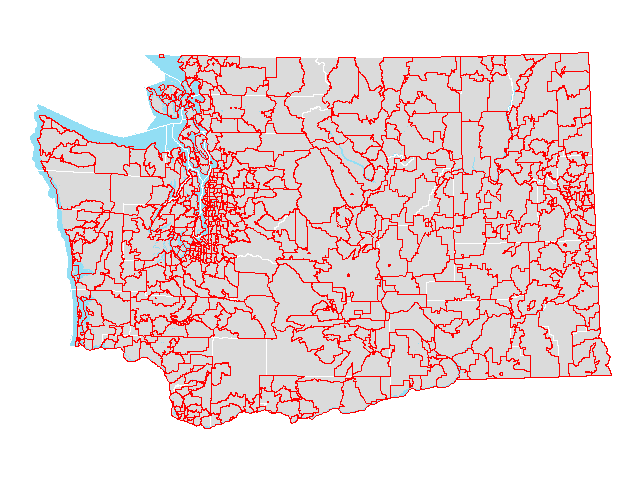 |
||||
| ZIP Code Tabulation Areas (county parts) | - | 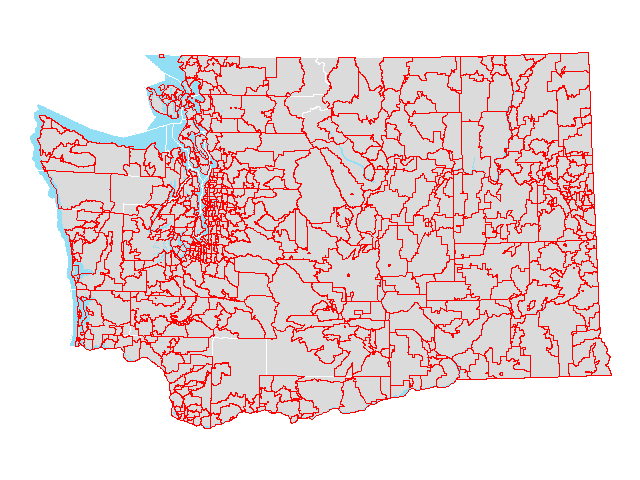 |
Estimates for other areas
| Summary Level | Table | GIS Shapefile |
KML File |
Preview | Metadata |
|---|---|---|---|---|---|
| Fire protection districts (unincorporated) | - | - | |||
| Public hospital districts (county parts), DOR | - | - | |||
| Selected islands (county parts) | 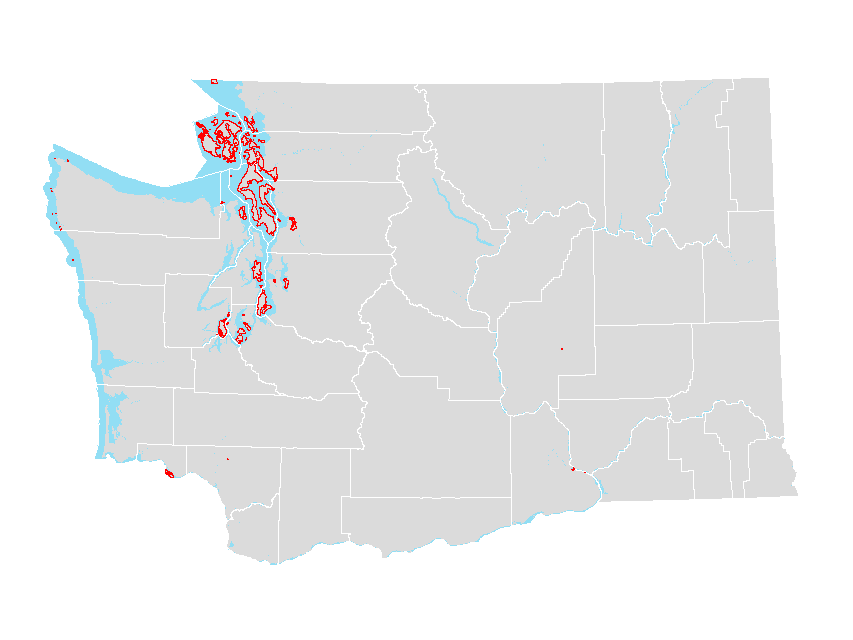 |
||||
| Water Resource Inventory Areas, ECY | - | 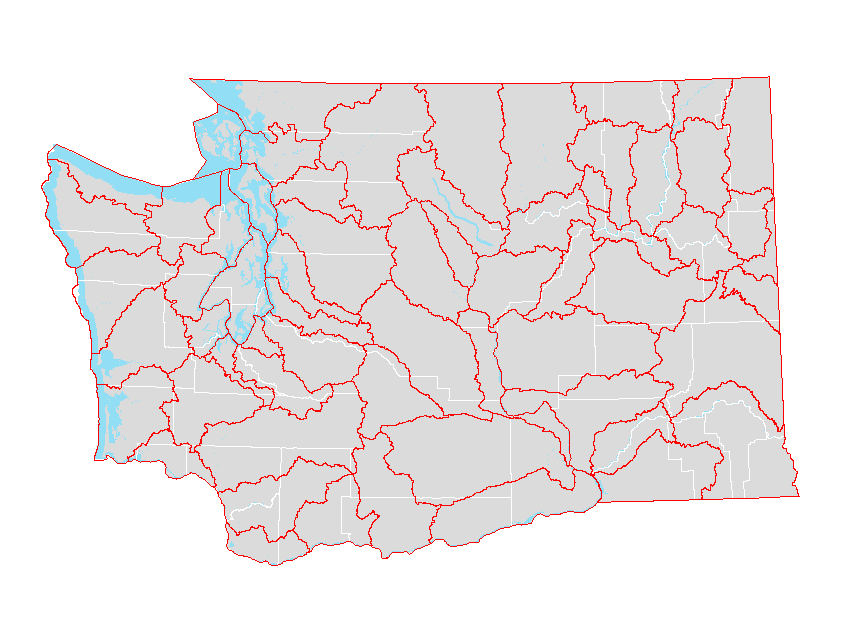 |
Note: To improve performance, the KML files have simplified polygon geometry.


